
Investor Day Presentation
March 31, 2026
Investor Day 2026 MARCH 31, 2026
INVESTOR DAY 2026 Forward-Looking Statements: This presentation includes “forward-looking statements” within the meaning of U.S. federal securities laws. Forward-looking statements are any statements other than statements of historical fact. Forward-looking statements are not guarantees of future performance, and actual results may differ materially from these statements. Forward-looking statements are often identified by words like “will,” “may,” “could,” “should,” “would,” “believe,” “estimate,” “expect,” “anticipate,” “plan,” “forecast,” “potential,” “intend,” “continue,” “project,” or negatives of these words or similar expressions. Forward-looking statements include, among others, statements regarding the following: our expected financial performance and outlook, including our estimated total sales volume for gold, silver, copper and other metals, DD&A, and effective tax rate for the year ended December 31, 2026 and gold equivalent ounces for 2026 and in the 5-year outlook, and the assumptions made in determining those estimates; operators’ expected operating and financial performance and other anticipated developments relating to their properties and operations, including production, deliveries, estimates of mineral resources and mineral reserves, environmental and feasibility studies, technical reports, mine plans, capital requirements, liquidity, and capital expenditures; opportunities for, and anticipated benefits from, investments, acquisitions and other transactions; receipt and timing of future metal deliveries and sales; anticipated liquidity, capital resources, financing, and stockholder returns; borrowings and repayments under our revolving credit facility; the materiality of properties within our portfolio; macroeconomic and market conditions; potential changes in the liquidity and trading multiples of our securities; potential impairments; and prices for gold, silver, copper, and other metals. Factors that could cause actual results to differ materially from these forward-looking statements include, among others, the following: changes in the price of gold, silver, copper, or other metals; operating activities or financial performance of properties on which we hold stream or royalty interests, including variations between actual and forecasted performance, operators’ ability to complete projects on schedule and as planned, operators’ changes to mine plans and mineral reserves and mineral resources (including updated mineral reserve and mineral resource information), liquidity needs, mining and environmental hazards, labor disputes, distribution and supply chain disruptions, permitting and licensing issues, other adverse government or court actions, or operational disruptions; the ultimate timing, outcome, and results of integrating the operations of Royal Gold, Sandstorm Gold and Horizon Copper; failure to realize the anticipated benefits from the Sandstorm Gold and Horizon Copper acquisition in the timeframe expected or at all; risks associated with joint arrangement interests acquired as part of the Sandstorm Gold and Horizon Copper acquisition; changes of control of properties or operators; contractual issues involving our stream or royalty agreements; the timing of deliveries of metals from operators and our subsequent sales of metal; risks associated with doing business in foreign countries; increased competition for stream and royalty interests; environmental risks, including those caused by climate change; potential cyber- attacks, including ransomware; our ability to identify, finance, value, and complete investments, acquisitions or other transactions; adverse economic and market conditions; effects of health epidemics and pandemics; changes in laws or regulations governing us, operators, or operating properties; changes in management and key employees; and other factors described in our reports filed with the Securities and Exchange Commission, including in Item 1A. Risk Factors of our most recent Annual Report on Form 10-K. Most of these factors are beyond our ability to predict or control. Other unpredictable or unknown factors not discussed in this presentation could also have material adverse effects on forward-looking statements. Forward-looking statements speak only as of the date on which they are made. We disclaim any obligation to update any forward-looking statements, except as required by law. Readers are cautioned not to put undue reliance on forward-looking statements. Third-party Information: Certain information provided in this presentation, including information about historical production, production estimates, property descriptions, and property developments, was provided to us by the operators of the relevant properties or is publicly available information filed by these operators with applicable securities regulatory bodies, including the Securities and Exchange Commission. Royal Gold has not verified, and is not in a position to verify, and expressly disclaims any responsibility for the accuracy, completeness or fairness of any such third-party information and refers the reader to the public reports filed by the operators for information regarding those properties. Mineral Reserve and Mineral Resource Information: Our stream and royalty interests often cover only a portion of the publicly reported mineral reserves, mineral resources, and production of a property or operation, and information publicly reported by operators may relate to a larger property or operation than the area covered by our stream or royalty interest. There are numerous uncertainties inherent in estimates of mineral reserves, mineral resources, and production, many of which are outside the operators’ control. As a result, estimates of mineral reserves, mineral resources, and production are subjective and necessarily depend upon a number of assumptions, including, among others, reliability of historical data, geologic and mining conditions, metallurgical recovery, metal prices, operating costs, capital expenditures, development and reclamation costs, mining technology improvements, and the effects of government regulation. Mineral resources are subject to future exploration and development and associated risks and may never convert to mineral reserves. If any of the assumptions that operators make in connection with estimates of mineral reserves, mineral resources, or production are incorrect, actual production could be significantly lower than estimated, which could adversely affect our future revenue and the value of our investments. In addition, if operators’ estimates with respect to the timing of production are incorrect, we may experience variances in expected revenue from period to period. The disclosures in this presentation may include resource and reserve information provided by operators that are foreign issuers which is not based on the Securities and Exchange Commission’s definitions for mineral resources and mineral reserves. We do not reconcile the resource and reserve estimates provided by the operators with the definitions of mineral resources and mineral reserves used by the Securities and Exchange Commission. The resource and reserve information included in this presentation cannot be included in the documents we file with the Securities and Exchange Commission. CAUTIONARY STATEMENTS 2

INVESTOR DAY THEMES Consistent Strategy Diversified Portfolio Embedded Growth
INVESTOR DAY 2026 1 Overview & Strategic Position Bill Heissenbuttel | President and CEO 2 Recent Acquisitions Jason Hynes | SVP, Strategy and Business Development ROYAL GOLD CORP. 3 Guidance & Portfolio Highlights Martin Raffield | SVP, Operations 4 Capital Allocation & Growth Strategy Paul Libner | SVP and CFO Dan Breeze | SVP, Corporate Development RGLD GOLD AG 5 Unique Attributes Alistair Baker | SVP, Investor Relations and Business Development ROYAL GOLD CORP. Q&A AGENDA 1 2 3 4 5 4
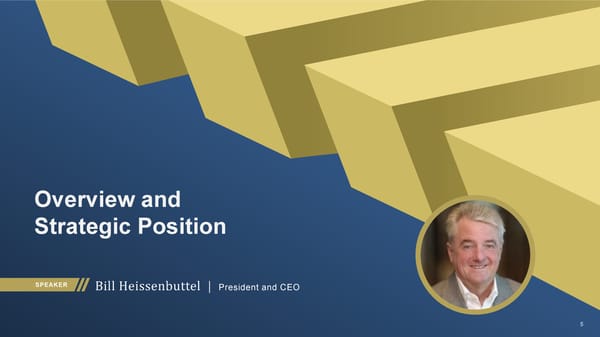
SPEAKER Overview and Strategic Position Bill Heissenbuttel | President and CEO 5
INVESTOR DAY 2026 The Royal Gold Investment Royal Gold can be a “set and forget ” full cycle investment 6 Strategy Exposure Upside Simple and consistent strategy Low -risk exposure to precious metals Upside exposure and growth through the cycle
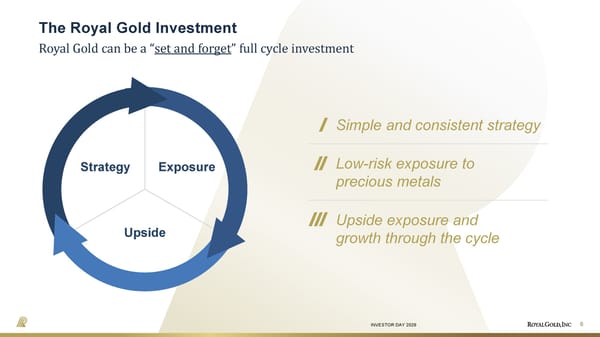
INVESTOR DAY 2026 Acquire high-quality and long-life precious metal assets in mining-friendly jurisdictions Finance growth with limited equity dilution Maintain strong balance sheet and liquidity Increase return to shareholders Strategic Goals Consistent, simple and long-standing 7
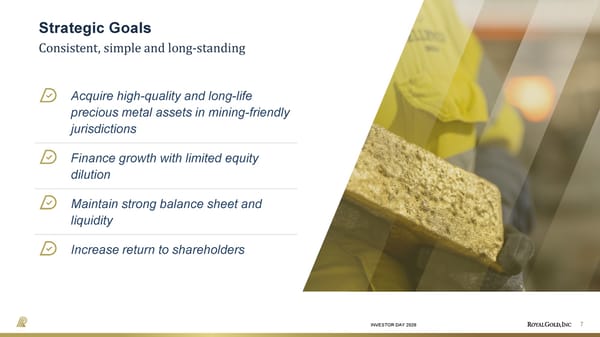
INVESTOR DAY 2026 Experienced Team Reduces Management Risk Board of Directors Senior Management Independent Director Retired SVP, Corporate Development at Teck Resources RO NAL D Vance Independent Director Retired Director, President and CEO at Barrick Gold JAMI E Sokalsky Independent Director Retired General Counsel at Barrick Gold SYBI L Veenman SVP, Investor Relations and Business Development, Royal Gold Corp. AL I ST AI R Baker SVP, Strategy and Business Development, Royal Gold Corp. J ASO N Hynes VP, Investment Stewardship AL L I SO N Forrest VP, Corporate Secretary and Chief Compliance Officer DAVI D Crandall C H A I R M A N 8 F ABI ANA Chubbs Independent Director Retired CFO at Eldorado Gold MARK Isto Non-Independent Director Retired EVP, COO at Royal Gold Corp. W IL L I AM Hayes Independent Director Retired EVP Project Development and Corporate Affairs at Placer Dome Non-Independent Director President and CEO of Royal Gold, Inc. W IL L I AM Heissenbuttel SVP, Operations MART I N Raffield SVP and CFO PAUL Libner SVP and General Counsel RANDY Shefman SVP, Corporate Development, RGLD Gold AG DAN Breeze
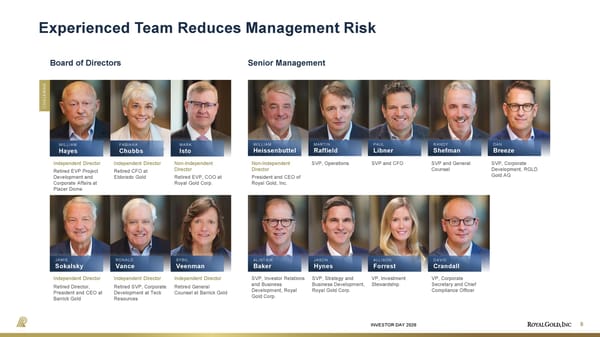
INVESTOR DAY 2026 Gold is a Unique Strategic Asset Source: World Gold Council: Gold As A Strategic Asset, 2026 Edition and Bloomberg, ICE Benchmark Administration, World Gold Council. 1) As of 31 December 2025. Relative value between ‘gold’: LBMA Gold Price PM; ‘commodities’: Bloomberg Commodity Index; and major currencies since 2000. Value of commodities and currencies measured in ounces of gold and indexed to 100 in January 2000. Gold is uncorrelated and a diversifier that provides a hedge against systemic risk, currency depreciation and inflation WHY GOLD? 140 Value in Gold 120 0 100 80 60 40 20 Pound Sterling Swiss franc US dollar Australian dollar Singapore dollar Euro Renminbi Commodities Yen Russian ruble Gold Currencies and Commodities Relative to Gold 1 January 2000 = 100 Safe-haven Asset Store of Value Liquid Asset Diversifier Hedge Against Inflation Competitive Return 9
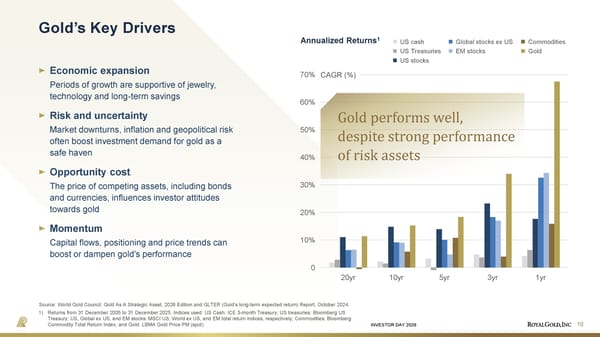
INVESTOR DAY 2026 Gold’s Key Drivers Source: World Gold Council: Gold As A Strategic Asset, 2026 Edition and GLTER (Gold’s long-term expected return) Report, October 2024. 1) Returns from 31 December 2005 to 31 December 2025. Indices used: US Cash: ICE 3-month Treasury; US treasuries: Bloomberg US Treasury; US, Global ex US, and EM stocks: MSCI US, World ex US, and EM total return indices, respectively; Commodities: Bloomberg Commodity Total Return Index; and Gold: LBMA Gold Price PM (spot). Annualized Returns 1 Global stocks ex US EM stocks Commodities Gold US cash US Treasuries US stocks Economic expansion Periods of growth are supportive of jewelry, technology and long-term savings Risk and uncertainty Market downturns, inflation and geopolitical risk often boost investment demand for gold as a safe haven Opportunity cost The price of competing assets, including bonds and currencies, influences investor attitudes towards gold Momentum Capital flows, positioning and price trends can boost or dampen gold's performance 20yr 10yr 5yr 3yr 1yr 0 10% 20% 30% 40% 50% 60% 70% CAGR (%) Gold performs well, despite strong performance of risk assets 10
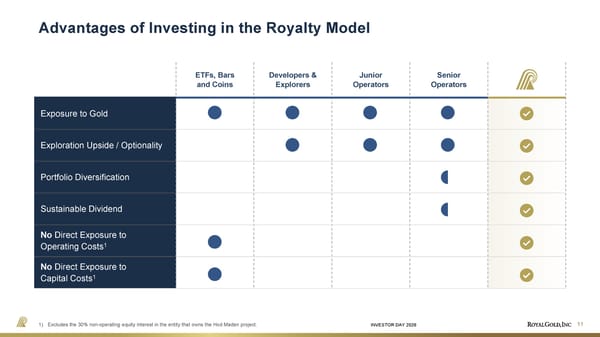
INVESTOR DAY 2026 ETFs, Bars and Coins Developers & Explorers Junior Operators Senior Operators Exposure to Gold Exploration Upside / Optionality Portfolio Diversification Sustainable Dividend No Direct Exposure to Operating Costs 1 No Direct Exposure to Capital Costs 1 Advantages of Investing in the Royalty Model 11 1) Excludes the 30% non-operating equity interest in the entity that owns the Hod Maden project.
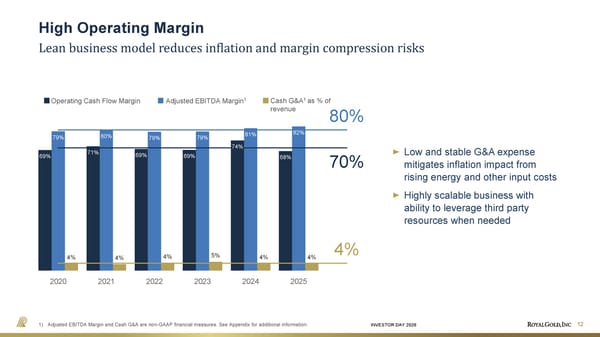
INVESTOR DAY 2026 69% 71% 69% 69% 74% 68% 79% 80% 79% 79% 81% 82% 4% 4% 4% 5% 4% 4% 80% 70% 4% 2020 2021 2022 2023 2024 2025 12 Low and stable G&A expense mitigates inflation impact from rising energy and other input costs Highly scalable business with ability to leverage third party resources when needed Lean business model reduces inflation and margin compression risks High Operating Margin 1) Adjusted EBITDA Margin and Cash G&A are non-GAAP financial measures. See Appendix for additional information. Adjusted EBITDA Margin 1 Operating Cash Flow Margin Cash G&A 1 as % of revenue
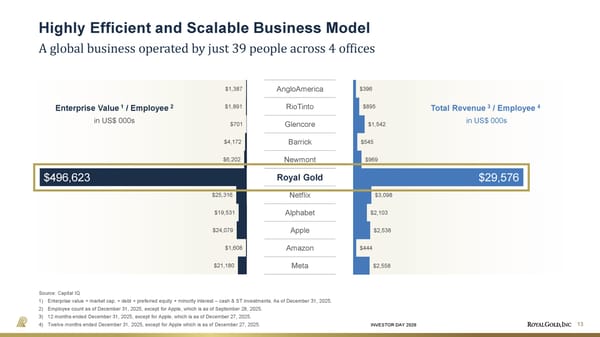
INVESTOR DAY 2026 AngloAmerica RioTinto Glencore Barrick Newmont Royal Gold Netflix Alphabet Apple Amazon Meta $2,558 $444 $2,538 $2,103 $3,098 $29,576 $969 $545 $1,542 $895 $396 $21,180 $1,608 $24,079 $19,531 $25,316 $496,623 $6,202 $4,172 $701 $1,891 $1,387 Highly Efficient and Scalable Business Model A global business operated by just 39 people across 4 offices Source: Capital IQ 1) Enterprise value = market cap. + debt + preferred equity + minority interest – cash & ST investments. As of December 31, 2025. 2) Employee count as of December 31, 2025, except for Apple, which is as of September 28, 2025. 3) 12 months ended December 31, 2025, except for Apple, which is as of December 27, 2025. 4) Twelve months ended December 31, 2025, except for Apple which is as of December 27, 2025. Enterprise Value 1 / Employee 2 in US$ 000s Total Revenue 3 / Employee 4 in US$ 000s 13
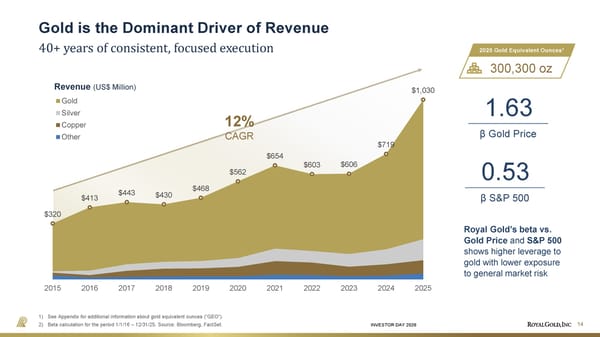
INVESTOR DAY 2026 $320 $413 $443 $430 $468 $562 $654 $603 $606 $719 $1,030 2015 2016 2017 2018 2019 2020 2021 2022 2023 2024 2025 Revenue (US$ Million) Gold Silver Copper Other 14 Gold is the Dominant Driver of Revenue 40+ years of consistent, focused execution 1) See Appendix for additional information about gold equivalent ounces (“GEO”). 2) Beta calculation for the period 1/1/16 – 12/31/25. Source: Bloomberg, FactSet. Royal Gold’s beta vs. Gold Price and S&P 500 shows higher leverage to gold with lower exposure to general market risk 1.63 β Gold Price 0.53 β S&P 500 2025 Gold Equivalent Ounces 1 300,300 oz 12% CAGR
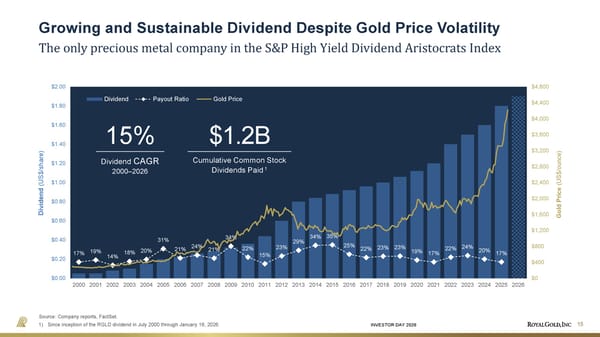
INVESTOR DAY 2026 17% 19% 14% 18% 20% 31% 21% 24% 21% 34% 22% 15% 23% 29% 34% 35% 25% 22% 23% 23% 19% 17% 22% 24% 20% 17% $0 $400 $800 $1,200 $1,600 $2,000 $2,400 $2,800 $3,200 $3,600 $4,000 $4,400 $4,800 $0.00 $0.20 $0.40 $0.60 $0.80 $1.00 $1.20 $1.40 $1.60 $1.80 $2.00 2000 2001 2002 2003 2004 2005 2006 2007 2008 2009 2010 2011 2012 2013 2014 2015 2016 2017 2018 2019 2020 2021 2022 2023 2024 2025 2026 Gold Price (US$/ounce) Dividend (US$/share) Dividend Payout Ratio Gold Price $0 $400 $800 $1,200 $1,600 $2,000 $2,400 $2,800 $3,200 $3,600 $4,000 $4,400 $4,800 $0.00 $0.20 $0.40 $0.60 $0.80 $1.00 $1.20 $1.40 $1.60 $1.80 $2.00 Gold Price (US$/ounce) Dividend (US$/share) 15 Growing and Sustainable Dividend Despite Gold Price Volatility The only precious metal company in the S&P High Yield Dividend Aristocrats Index Source: Company reports, FactSet. 1) Since inception of the RGLD dividend in July 2000 through January 16, 2026. 15% Dividend CAGR 2000–2026 $1.2B Cumulative Common Stock Dividends Paid 1
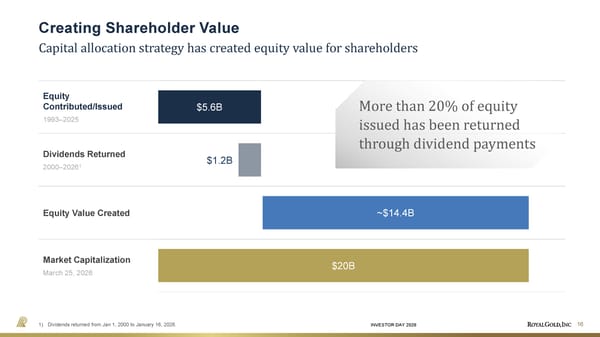
INVESTOR DAY 2026 16 Creating Shareholder Value $5.6B ~$14.4B $1.2B $20B Capital allocation strategy has created equity value for shareholders 1) Dividends returned from Jan 1, 2000 to January 16, 2026. Equity Contributed/Issued 1993–2025 Dividends Returned 2000–2026 1 Equity Value Created Market Capitalization March 25, 2026 More than 20% of equity issued has been returned through dividend payments
SPEAKER Recent Acquisitions Advancing Our Strategic Priorities Jason Hynes | SVP, Strategy and Business Development Royal Gold Corp. 17
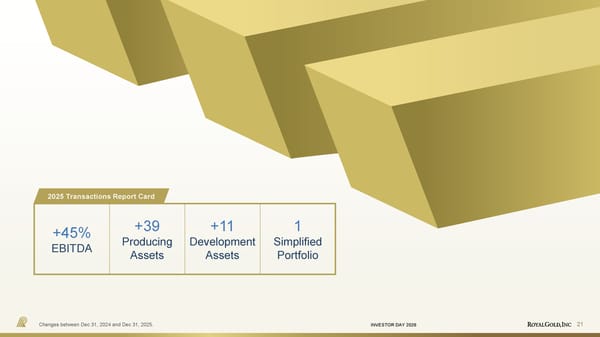
INVESTOR DAY 2026 $200M, gold stream and royalty Long-life growth asset, large AOI Warintza $4.1B, acquisition of royalty companies Diversification, growth, long-life assets Sandstorm & Horizon $1B, gold stream Long life asset, in production Kansanshi Larger, higher-cash-flow portfolio Faster growth trajectory Stronger long-term growth outlook More diversified, lower-risk asset base 18 Cementing Royal Gold as a leading North American streaming and royalty company Accretive Transactions in 2025
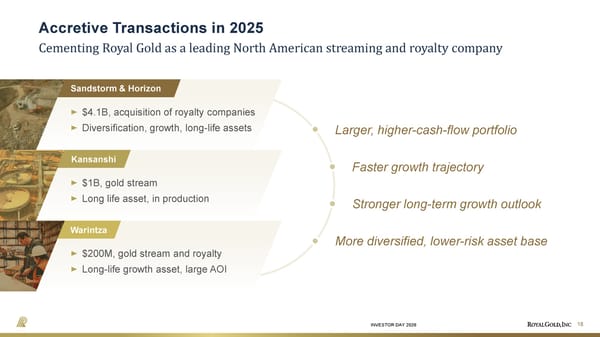
INVESTOR DAY 2026 Advancing Our Post-Transaction Priorities Fully collapsed the Horizon Copper structure Divested +$200M of equity positions Restructured Bear Creek assets ↳ Supported Bear Creek’s merger with Highlander Silver ↳ Converted debt and other interests into royalty assets, including Corani Began with $1.225B outstanding at close of the Sandstorm/Horizon transaction (Oct 20, 2025); initial expectation of repayment by mid-2027 Already repaid $625M since closing; targeting full repayment by early Q1 2027 (6 months faster) Increased dividend for the 25th consecutive year Simplified Portfolio Accelerated Debt Repayment Consistent Capital Returns 19
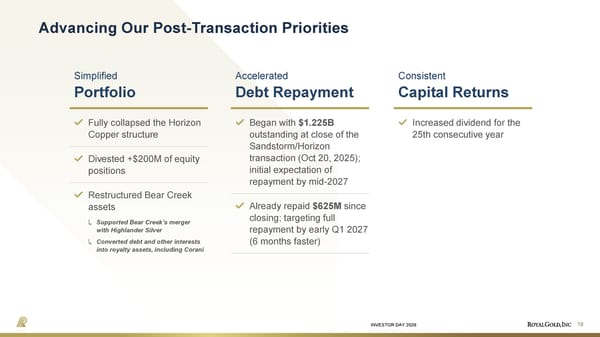
INVESTOR DAY 2026 PLATREEF MARA MOUNT MILLIGAN Positive Developments Supporting Long-Term Growth 20 Assets Acquired in 2025 Royal Gold Legacy Assets Platreef First concentrate produced November 2025 MARA RIGI application, Alumbrera restart December 2025 Kansanshi S3 Commercial Production December 2025 Hod Maden Technical Report January 2026 Fruta del Norte Extend porphyry corridor February 2026 Fourmile Preliminary PEA September 2025 Mt. Milligan Mine life extension September 2025 Khoemaca u Expansion approved December 2025
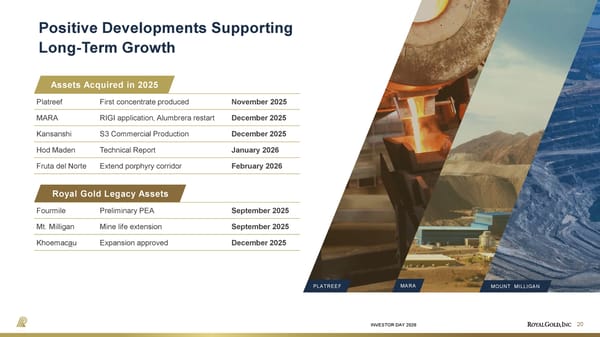
INVESTOR DAY 2026 21 +45% EBITDA +39 Producing Assets +11 Development Assets 1 Simplified Portfolio Changes between Dec 31, 2024 and Dec 31, 2025. 2025 Transactions Report Card
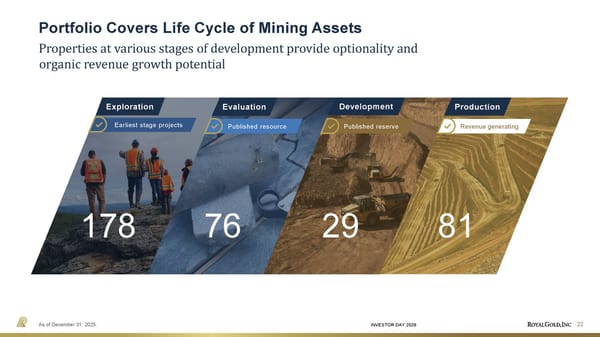
INVESTOR DAY 2026 Portfolio Covers Life Cycle of Mining Assets Properties at various stages of development provide optionality and organic revenue growth potential As of December 31, 2025. 178 76 29 81 Exploration Evaluation Development Production Published resource Published reserve Revenue generating Earliest stage projects 22
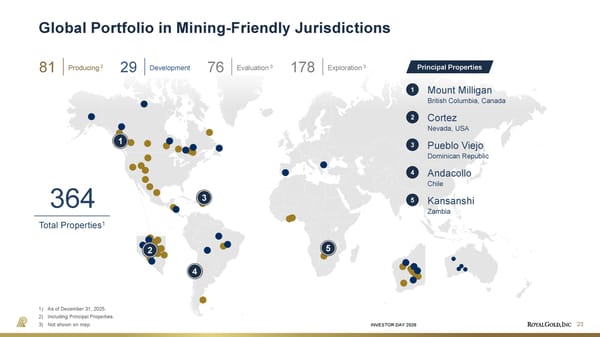
INVESTOR DAY 2026 Global Portfolio in Mining-Friendly Jurisdictions 1) As of December 31, 2025. 2) Including Principal Properties. 3) Not shown on map. 364 Total Properties 1 Mount Milligan British Columbia, Canada Cortez Nevada, USA Pueblo Viejo Dominican Republic Andacollo Chile Kansanshi Zambia 81 Producing 2 29 Development 76 Evaluation 3 178 Exploration 3 1 2 3 4 5 Principal Properties 1 2 3 4 5 23
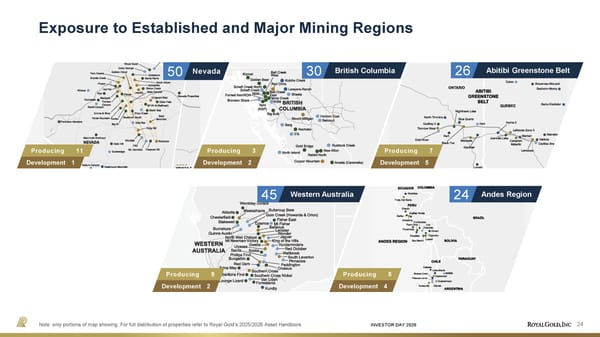
INVESTOR DAY 2026 Exposure to Established and Major Mining Regions Note: only portions of map showing. For full distribution of properties refer to Royal Gold’s 2025/2026 Asset Handbook. 24 Development 2 Producing 3 50 Nevada 30 British Columbia 26 Abitibi Greenstone Belt Development 1 Producing 11 Development 5 Producing 7 45 Western Australia Development 2 Producing 9 24 Andes Region Development 4 Producing 5
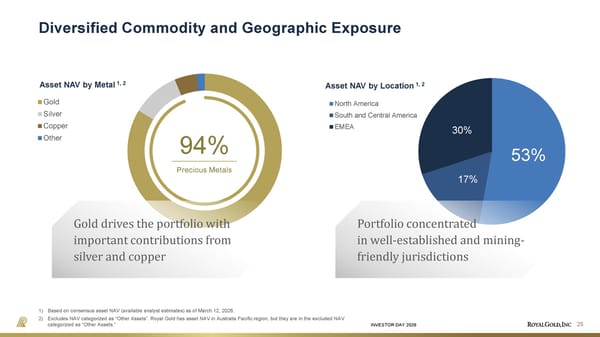
INVESTOR DAY 2026 Asset NAV by Metal 1, 2 Gold Silver Copper Other 53% 17% 30% Asset NAV by Location 1, 2 North America South and Central America EMEA Diversified Commodity and Geographic Exposure 1) Based on consensus asset NAV (available analyst estimates) as of March 12, 2026. 2) Excludes NAV categorized as “Other Assets”. Royal Gold has asset NAV in Australia Pacific region, but they are in the excluded NAV categorized as “Other Assets.” 94% Precious Metals Gold drives the portfolio with important contributions from silver and copper Portfolio concentrated in well-established and mining- friendly jurisdictions 25
INVESTOR DAY 2026 NAV by Asset 1, 2 Mt. Milligan Pueblo Viejo Kansanshi Cortez Andacollo Khoemacau Platreef Hod Maden Antamina MARA 17% 11% 9% 9% 7% 6% 5% 4% 4% NAV by Counterparty 1 Centerra Gold Barrick Teck Resources First Quantum Nevada Gold Mines MMG Limited Glencore plc Other Diversified Asset Portfolio Operated by Leading Counterparties 1) Based on consensus asset NAV (available analyst estimates) as of March 12, 2026. 2) Excludes NAV categorized as “Other Assets”. 70% Top 10 Assets High diversification and low concentration within the portfolio mitigates single-asset risk Our portfolio counterparties are well-capitalized, established and experienced 26
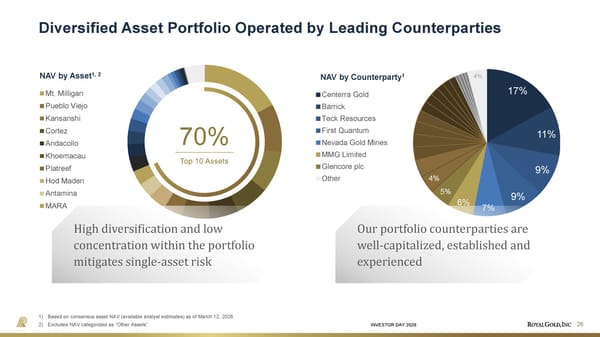
INVESTOR DAY 2026 27 Significant Growth in Attributable GEOs 0 1 2 3 4 5 6 7 8 9 10 2024 2025 2024 2025 Principal Producing Development Evaluation Acquisitions and organic developments provided increases across the portfolio 1) Attributable GEO reserves and resources (AGEOs) are a measure calculated by Royal Gold to define the portion of an operator’s reported reserves or resources that are attributable to Royal Gold’s royalty or stream interest. Measured and Indicated AGEOs exclude reserves. Refer to Royal Gold’s 2025/2026 Asset Handbook for a discussion of the calculation methodology and limitations. 2) Metal prices used for 2024 AGEOs: $2,550/oz gold, $30/oz silver, $4.00/lb copper, $0.85/lb lead, $1.20/lb zinc, $6.75/lb nickel, $13/lb cobalt, $19/lb molybdenum. 3) Metal prices used for 2025 AGEOs: $4,000/oz gold, $55/oz silver, $5.00/lb copper, $0.91/lb lead, $1.35/lb zinc, $7.30/lb nickel, $20/lb cobalt, $21/lb molybdenum. 4.3M AGEOs 7.0M AGEOs 4.6M AGEOs 5.6M AGEOs in M ounces Proven & Probable Measured & Indicated
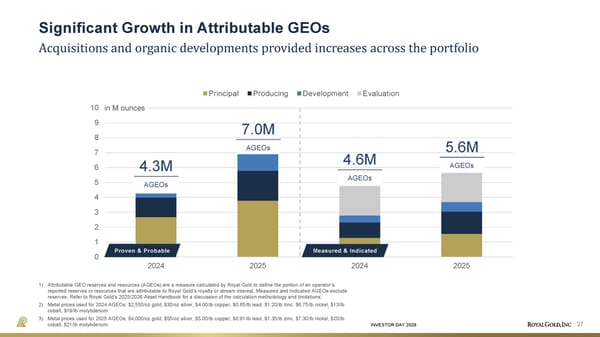
INVESTOR DAY 2026 28 Enhanced Portfolio Duration 0–5 years 0–5 years 5–10 years 5–10 years 10–15 years 10–15 years 15–20 years 15–20 years 20–25 years 20–25 years 25–30 years 25–30 years 30+ years 30+ years 0% 5% 10% 15% 20% 25% 30% 35% 40% 45% Portfolio Prior to 2025 Mine Life Current Portfolio Mine Life Shift toward longer-life portfolio driven by disciplined M&A and organic developments Mine life as reported by operator and is weighted by NAV. Assets included account for 90% of Royal Gold asset NAV. The Portfolio Prior to 2025 excludes assets acquired in 2025, the Mt. Milligan mine life extension announced in September 2025, and the Fourmile project PEA results announced in September 2025. 14.5yr Weighted Average Mine Life 18yr Weighted Average Mine Life of NAV
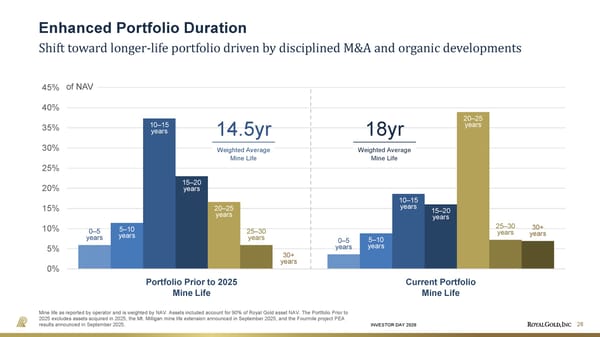
INVESTOR DAY 2026 $97 $6 $165 July 3, 2025 (Pre-Sandstorm/Horizon) Expected Accretion Current March 25, 2026 29 Value created for Royal Gold shareholders via: Metal price increase Positive portfolio developments — Mount Milligan mine life extension — Fourmile exploration success — Khoemaca u expansion — MARA RIGI and development plan — Platreef start-up Accretive transactions — Sandstorm/Horizon — Kansanshi gold stream — Warintza stream & royalty Large and gold-focused portfolio provides leverage to higher metal prices Value Created for Royal Gold Shareholders 1) CapIQ consensus estimates (July 3, 2025, and March 25, 2026). 2) Expected Accretion is a Royal Gold estimate using consensus estimates at the time of announcing Sandstorm/Horizon acquisition. 6% 70% Significant NAV/share Accretion in 2025 1 1 2
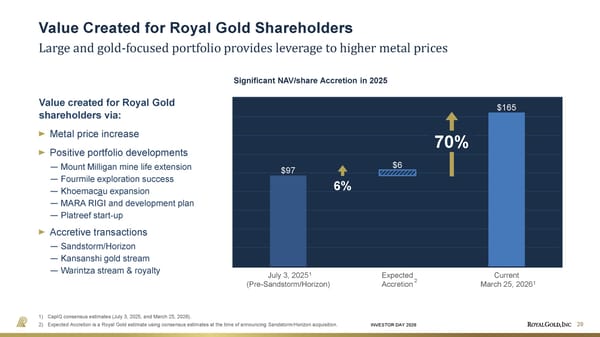
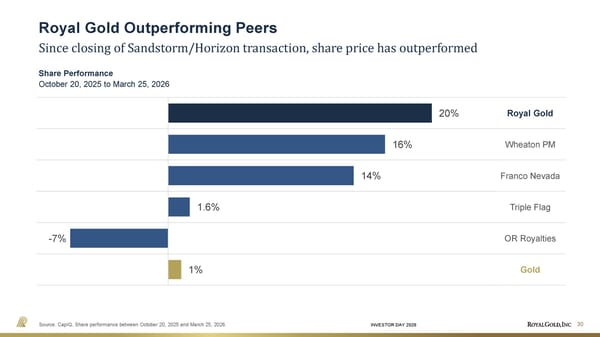
INVESTOR DAY 2026 30 Royal Gold Outperforming Peers 1% - 7% 1.6% 14% 16% 20% Since closing of Sandstorm/Horizon transaction, share price has outperformed Source: CapIQ, Share performance between October 20, 2025 and March 25, 2026. Royal Gold Wheaton PM Franco Nevada Triple Flag OR Royalties Gold Share Performance October 20, 2025 to March 25, 2026
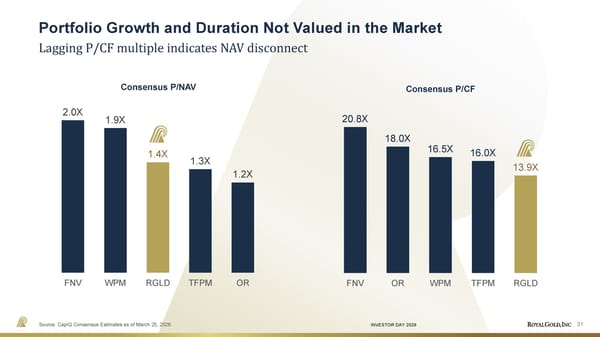
INVESTOR DAY 2026 2.0X 1.9X 1.4X 1.3X 1.2X FNV WPM RGLD TFPM OR Consensus P/NAV 20.8X 18.0X 16.5X 16.0X 13.9X FNV OR WPM TFPM RGLD Consensus P/CF 31 Portfolio Growth and Duration Not Valued in the Market Lagging P/CF multiple indicates NAV disconnect Source: CapIQ Consensus Estimates as of March 25, 2026.
SPEAKER Guidance and Portfolio Highlights Martin Raffield | SVP, Operations 32
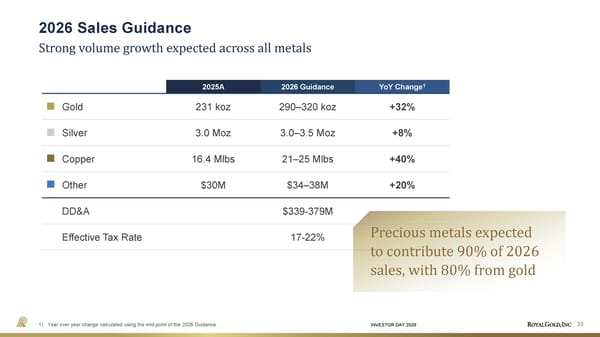
INVESTOR DAY 2026 2025A 2026 Guidance YoY Change 1 Gold 231 koz 290–320 koz +32% Silver 3.0 Moz 3.0–3.5 Moz +8% Copper 16.4 Mlbs 21–25 Mlbs +40% Other $30M $34–38M +20% DD&A $339-379M Effective Tax Rate 17-22% 33 2026 Sales Guidance Strong volume growth expected across all metals 1) Year over year change calculated using the mid-point of the 2026 Guidance. Precious metals expected to contribute 90% of 2026 sales, with 80% from gold
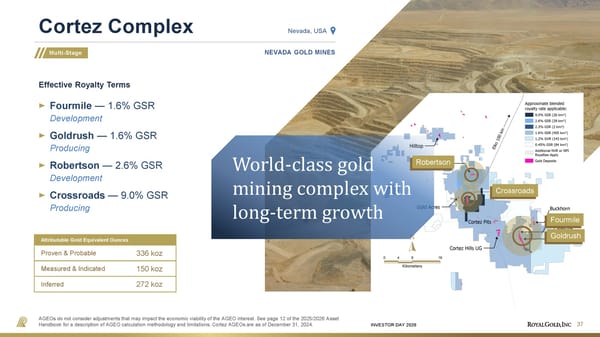
INVESTOR DAY 2026 34 Long-Term Outlook +50k GEOs 2025 Actuals 2026 Range 5 Year Outlook Additional Long-Term Potential Expansions and new production are expected to drive longer-term growth 1) 2026 Range represents 2026 Guidance expressed in GEOs for comparison purposes only. 2026 Range is risk-adjusted by individual asset; 5 Year Outlook and Additional Long-Term Potential are based on the mid-points of operator guidance, production estimates provided by operators at steady state, and Royal Gold estimates, and are not risk-adjusted. 2026 Range provided for comparison purposes, and when comparing actual performance to guidance during 2026, we will refer only to sales volume by metal and not to a GEO range. 2) GEOs calculated at $4,000/oz Au, $55/oz Ag, $5/lb Cu, $7.30/lb Ni, $1.35/lb Zn, $0.91/lb Pb; 2026 Range uses mid-point of metal unit ranges for 2026 Guidance. 3) 5 Year Outlook includes expected stream rate step downs at Wassa and Rainy River (silver stream only). + New Mines Platreef Back River + 2025 Acquisitions Sandstorm/Horizon Kansanshi Excludes Mt. Milligan Deferred Gold Consideration payment 300k GEOs 365–410k GEOs 430–480k GEOs + New Mines La India Robertson (Cortez) Hod Maden (NSR) Great Bear Warintza Corani + Expansions Khoemaca u Platreef Phase 2 Bald Mt. Redbird 2 Excludes Hod Maden (30% JV) + New Mines MARA Fourmile (Cortez) Cactus (royalty area) Gualcamayo Horne 5 Oyu Tolgoi + Expansions Platreef Phase 3 Other Copper Silver Gold
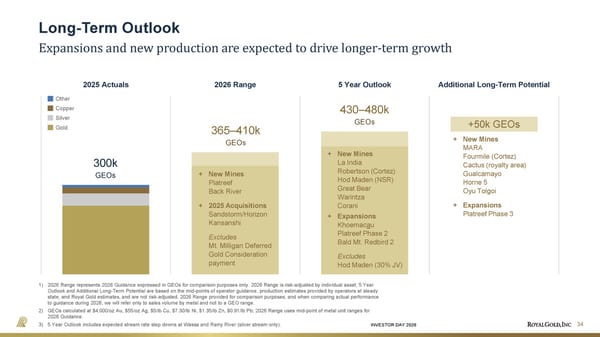
INVESTOR DAY 2026 Warintza Great Bear Robust Development Pipeline Multi-year catalysts within the portfolio provide organic growth potential Hod Maden Platreef Phase II Robertson (Cortez) B2GOLD IVANHOE MINES NEVADA GOLD MINES SSR MINING 2026 35 KINROSS SOLARIS RESOURCES GLENCORE ARIZONA SONORAN BARRICK MINING RIO TINTO A IS A GROUP Oyu Tolgoi (HNE) Gualcamayo Cactus Fourmile (Cortez) MARA 2030+ La India METALS EXPLORATION Back River
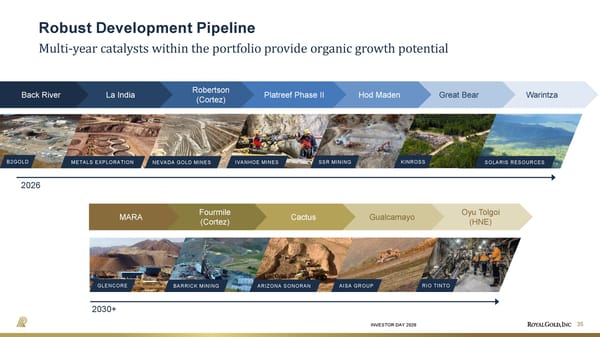
INVESTOR DAY 2026 Production Time 36 Multiplier Effect Creates Optionality Mine life extension provides longer exposure to metal prices More production × longer exposure = higher return Incremental production due to resource conversion Mine plan based on reserves Over 2 million meters of drilling completed across properties in which we hold interests in 2025
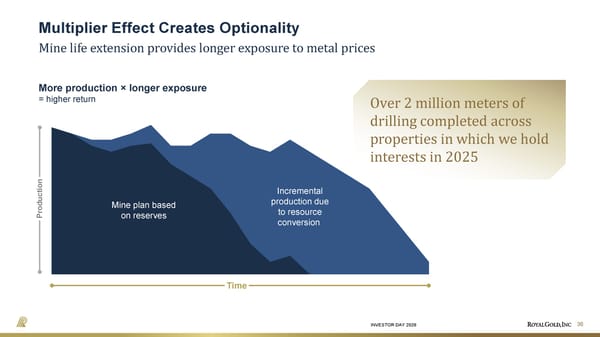
INVESTOR DAY 2026 Attributable Gold Equivalent Ounces Proven & Probable Measured & Indicated Inferred Cortez Complex 37 Multi-Stage NEVADA GOLD MINES Nevada, USA Effective Royalty Terms Fourmile — 1.6% GSR Development Goldrush — 1.6% GSR Producing Robertson — 2.6% GSR Development Crossroads — 9.0% GSR Producing 336 koz 150 koz 272 koz World-class gold mining complex with long-term growth Crossroads Fourmile Goldrush Robertson AGEOs do not consider adjustments that may impact the economic viability of the AGEO interest. See page 12 of the 2025/2026 Asset Handbook for a description of AGEO calculation methodology and limitations. Cortez AGEOs are as of December 31, 2024.
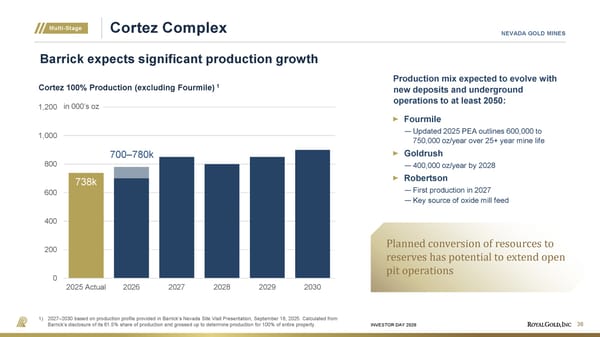
INVESTOR DAY 2026 738k 0 200 400 600 800 1,000 1,200 2025 Actual 2026 2027 2028 2029 2030 in 000’s oz 700–780k Cortez Complex 38 1) 2027–2030 based on production profile provided in Barrick’s Nevada Site Visit Presentation, September 18, 2025. Calculated from Barrick’s disclosure of its 61.5% share of production and grossed up to determine production for 100% of entire property. Multi-Stage NEVADA GOLD MINES Barrick expects significant production growth Production mix expected to evolve with new deposits and underground operations to at least 2050: Fourmile — Updated 2025 PEA outlines 600,000 to 750,000 oz/year over 25+ year mine life Goldrush — 400,000 oz/year by 2028 Robertson — First production in 2027 — Key source of oxide mill feed Cortez 100% Production (excluding Fourmile) 1 Planned conversion of resources to reserves has potential to extend open pit operations
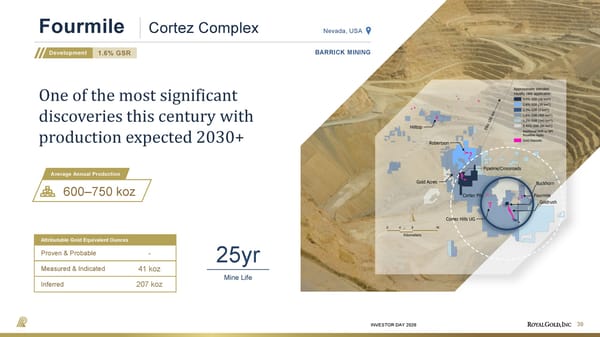
INVESTOR DAY 2026 Attributable Gold Equivalent Ounces Proven & Probable Measured & Indicated Inferred 1.6% GSR 25yr Fourmile 39 Development BARRICK MINING Nevada, USA - 41 koz 207 koz Mine Life Average Annual Production 600–750 koz Cortez Complex One of the most significant discoveries this century with production expected 2030+
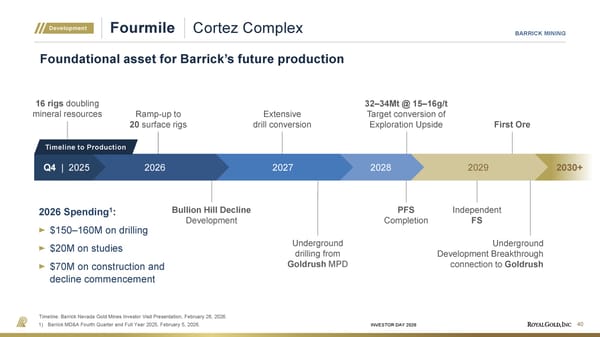
INVESTOR DAY 2026 Independent FS 2026 Spending 1 : $150 –160M on drilling $20M on studies $70M on construction and decline commencement Fourmile 40 Timeline: Barrick Nevada Gold Mines Investor Visit Presentation, February 26, 2026. 1) Barrick MD&A Fourth Quarter and Full Year 2025, February 5, 2026. Development BARRICK MINING Foundational asset for Barrick’s future production Cortez Complex 16 rigs doubling mineral resources Ramp-up to 20 surface rigs 32–34Mt @ 15–16g/t Target conversion of Exploration Upside First Ore Bullion Hill Decline Development 2030+ 2029 2028 2027 2026 Q4 | 2025 Extensive drill conversion Underground drilling from Goldrush MPD PFS Completion Underground Development Breakthrough connection to Goldrush Timeline to Production
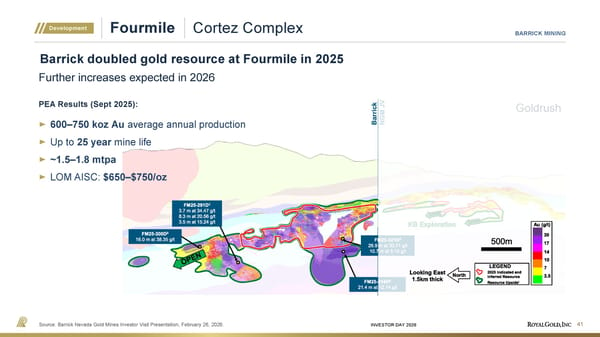
INVESTOR DAY 2026 Fourmile 41 Source: Barrick Nevada Gold Mines Investor Visit Presentation, February 26, 2026. Development BARRICK MINING Barrick doubled gold resource at Fourmile in 2025 Cortez Complex 600 –750 koz Au average annual production Up to 25 year mine life ~1.5–1.8 mtpa LOM AISC: $650–$750/oz Further increases expected in 2026 Goldrush PEA Results (Sept 2025):
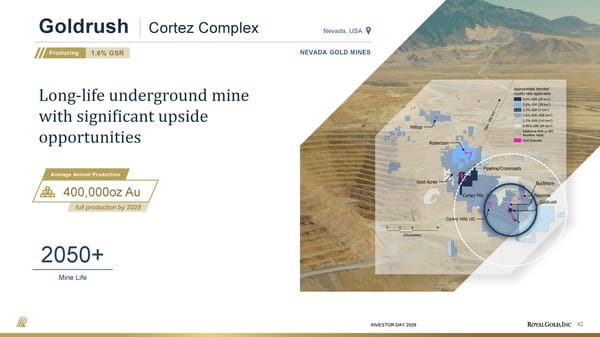
INVESTOR DAY 2026 Attributable Gold Equivalent Ounces Proven & Probable Measured & Indicated Inferred 1.6% GSR Goldrush Producing NEVADA GOLD MINES Nevada, USA Cortez Complex Long-life underground mine with significant upside opportunities full production by 2028 Average Annual Production 400,000oz Au 2050+ Mine Life 42
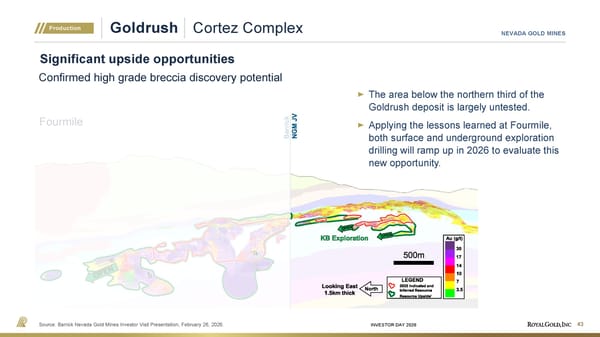
INVESTOR DAY 2026 Goldrush 43 Source: Barrick Nevada Gold Mines Investor Visit Presentation, February 26, 2026. Production NEVADA GOLD MINES Significant upside opportunities Cortez Complex 43 The area below the northern third of the Goldrush deposit is largely untested. Applying the lessons learned at Fourmile, both surface and underground exploration drilling will ramp up in 2026 to evaluate this new opportunity. Fourmile Confirmed high grade breccia discovery potential
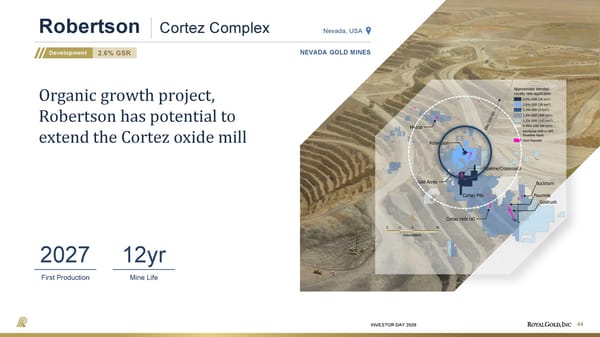
INVESTOR DAY 2026 Attributable Gold Equivalent Ounces Proven & Probable Measured & Indicated Inferred 2.6% GSR Robertson 44 Development NEVADA GOLD MINES Nevada, USA Cortez Complex Organic growth project, Robertson has potential to extend the Cortez oxide mill 2027 First Production 12yr Mine Life
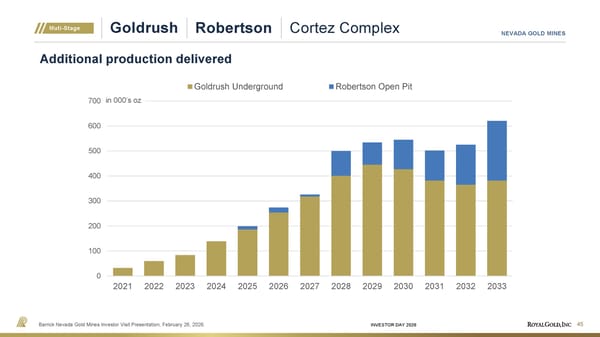
INVESTOR DAY 2026 Goldrush 45 Barrick Nevada Gold Mines Investor Visit Presentation, February 26, 2026. Muti-Stage NEVADA GOLD MINES Additional production delivered Robertson 0 100 200 300 400 500 600 700 2021 2022 2023 2024 2025 2026 2027 2028 2029 2030 2031 2032 2033 Goldrush Underground Robertson Open Pit in 000’s oz Cortez Complex
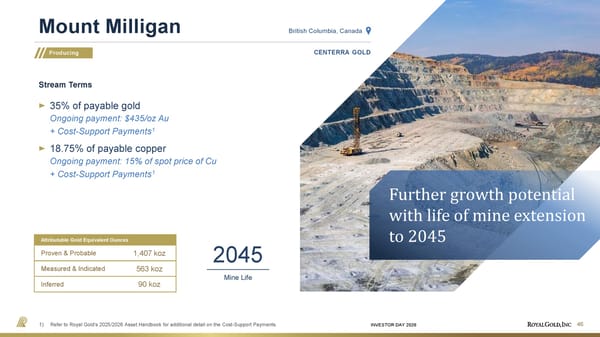
INVESTOR DAY 2026 Attributable Gold Equivalent Ounces Proven & Probable Measured & Indicated Inferred 2045 Mount Milligan 46 Producing CENTERRA GOLD British Columbia, Canada Stream Terms 35% of payable gold Ongoing payment: $435/oz Au + Cost-Support Payments 1 18.75% of payable copper Ongoing payment: 15% of spot price of Cu + Cost-Support Payments 1 1,407 koz 563 koz 90 koz Mine Life Further growth potential with life of mine extension to 2045 1) Refer to Royal Gold’s 2025/2026 Asset Handbook for additional detail on the Cost-Support Payments.
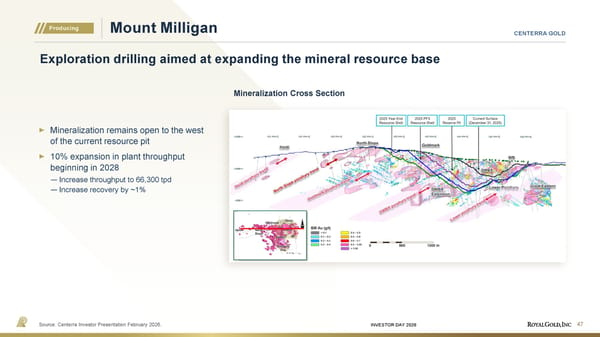
INVESTOR DAY 2026 Mount Milligan 47 Source: Centerra Investor Presentation February 2026. Producing CENTERRA GOLD Exploration drilling aimed at expanding the mineral resource base Mineralization remains open to the west of the current resource pit 10% expansion in plant throughput beginning in 2028 — Increase throughput to 66,300 tpd — Increase recovery by ~1% Mineralization Cross Section
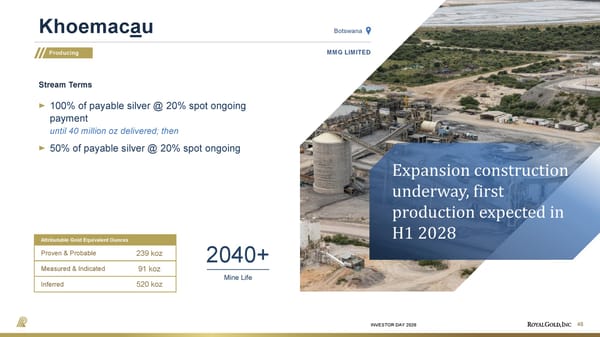
INVESTOR DAY 2026 Attributable Gold Equivalent Ounces Proven & Probable Measured & Indicated Inferred 2040+ Khoemaca u 48 Producing MMG LIMITED Botswana Stream Terms 100% of payable silver @ 20% spot ongoing payment until 40 million oz delivered; then 50% of payable silver @ 20% spot ongoing 239 koz 91 koz 520 koz Mine Life Expansion construction underway, first production expected in H1 2028
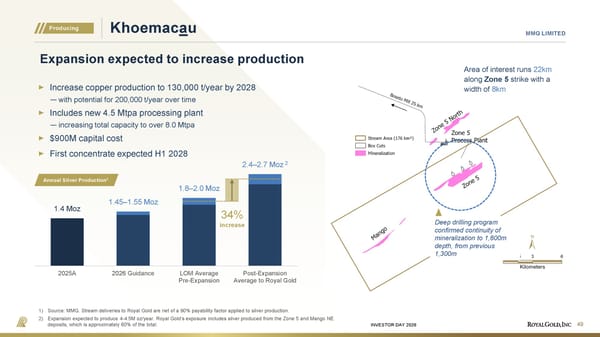
INVESTOR DAY 2026 Khoemaca u 49 1) Source: MMG. Stream deliveries to Royal Gold are net of a 90% payability factor applied to silver production. 2) Expansion expected to produce 4-4.5M oz/year. Royal Gold’s exposure includes silver produced from the Zone 5 and Mango NE deposits, which is approximately 60% of the total. Producing MMG LIMITED Expansion expected to increase production Increase copper production to 130,000 t/year by 2028 — with potential for 200,000 t/year over time Includes new 4.5 Mtpa processing plant — increasing total capacity to over 8.0 Mtpa $900M capital cost First concentrate expected H1 2028 1.4 Moz 1.45–1.55 Moz 1.8–2.0 Moz 2.4–2.7 Moz 2 2025A 2026 Guidance LOM Average Pre-Expansion Post-Expansion Average to Royal Gold Annual Silver Production 1 34% increase Deep drilling program confirmed continuity of mineralization to 1,800m depth, from previous 1,300m Area of interest runs 22km along Zone 5 strike with a width of 8km
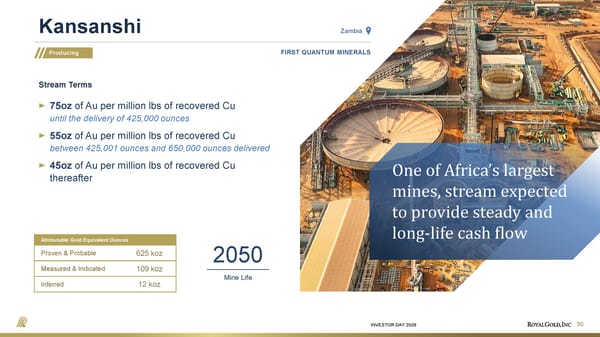
INVESTOR DAY 2026 Attributable Gold Equivalent Ounces Proven & Probable Measured & Indicated Inferred 2050 Kansanshi 50 Producing FIRST QUANTUM MINERALS Zambia Stream Terms 75oz of Au per million lbs of recovered Cu until the delivery of 425,000 ounces 55oz of Au per million lbs of recovered Cu between 425,001 ounces and 650,000 ounces delivered 45oz of Au per million lbs of recovered Cu thereafter 625 koz 109 koz 12 koz Mine Life One of Africa’s largest mines, stream expected to provide steady and long-life cash flow
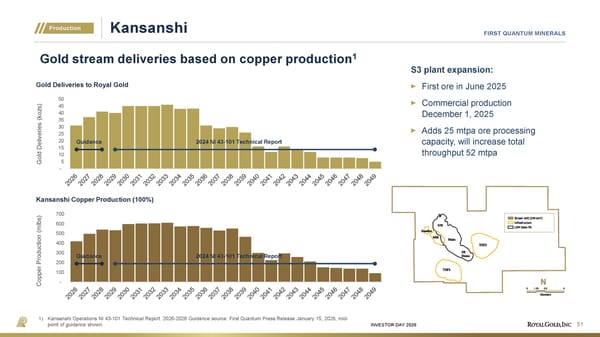
INVESTOR DAY 2026 Kansanshi 51 1) Kansanshi Operations NI 43-101 Technical Report. 2026-2028 Guidance source: First Quantum Press Release January 15, 2026, mid- point of guidance shown. Production FIRST QUANTUM MINERALS Gold stream deliveries based on copper production 1 S3 plant expansion: First ore in June 2025 Commercial production December 1, 2025 Adds 25 mtpa ore processing capacity, will increase total throughput 52 mtpa - 100 200 300 400 500 600 700 Copper Production (mlbs) Kansanshi Copper Production (100%) - 5 10 15 20 25 30 35 40 45 50 Gold Deliveries (kozs) Gold Deliveries to Royal Gold Guidance 2024 NI 43-101 Technical Report Guidance 2024 NI 43-101 Technical Report
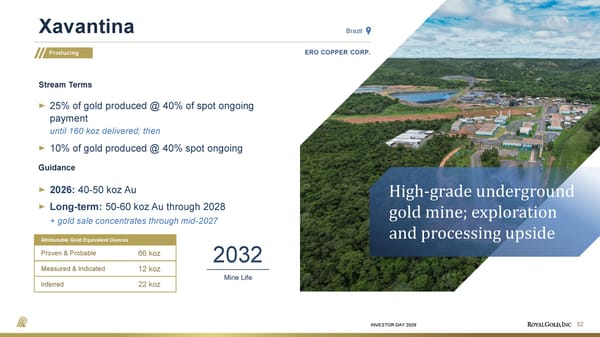
INVESTOR DAY 2026 Attributable Gold Equivalent Ounces Proven & Probable Measured & Indicated Inferred 2032 Xavantina 52 Producing ERO COPPER CORP. Brazil Stream Terms 25% of gold produced @ 40% of spot ongoing payment until 160 koz delivered; then 10% of gold produced @ 40% spot ongoing 66 koz 12 koz 22 koz Mine Life High-grade underground gold mine; exploration and processing upside Guidance 2026: 40-50 koz Au Long-term: 50-60 koz Au through 2028 + gold sale concentrates through mid-2027
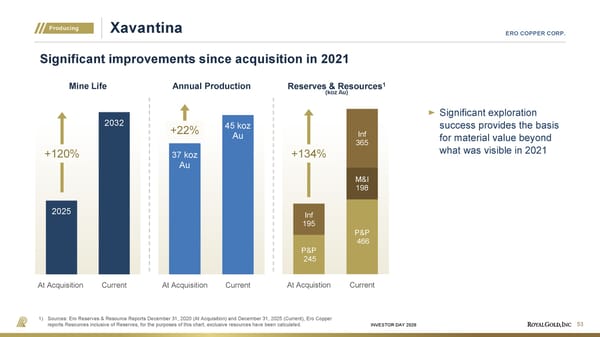
INVESTOR DAY 2026 Xavantina 53 1) Sources: Ero Reserves & Resource Reports December 31, 2020 (At Acquisition) and December 31, 2025 (Current), Ero Copper reports Resources inclusive of Reserves, for the purposes of this chart, exclusive resources have been calculated. Producing ERO COPPER CORP. Significant improvements since acquisition in 2021 Significant exploration success provides the basis for material value beyond what was visible in 2021 2025 2032 At Acquisition Current Mine Life 37 koz Au 45 koz Au At Acquisition Current Annual Production P&P 245 P&P 466 M&I 198 Inf 195 Inf 365 At Acquistion Current Reserves & Resources 1 (koz Au) +120% +22% +134%
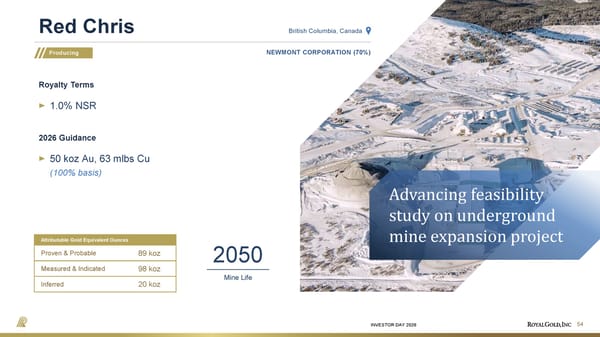
INVESTOR DAY 2026 Attributable Gold Equivalent Ounces Proven & Probable Measured & Indicated Inferred 2050 Red Chris 54 Producing NEWMONT CORPORATION (70%) British Columbia, Canada Royalty Terms 1.0% NSR 89 koz 98 koz 20 koz Mine Life Advancing feasibility study on underground mine expansion project 2026 Guidance 50 koz Au, 63 mlbs Cu (100% basis)
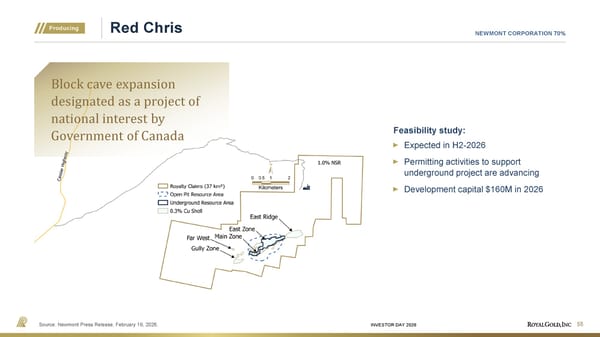
INVESTOR DAY 2026 Red Chris 55 Source: Newmont Press Release, February 19, 2026. Producing NEWMONT CORPORATION 70% Feasibility study: Expected in H2-2026 Permitting activities to support underground project are advancing Development capital $160M in 2026 Block cave expansion designated as a project of national interest by Government of Canada
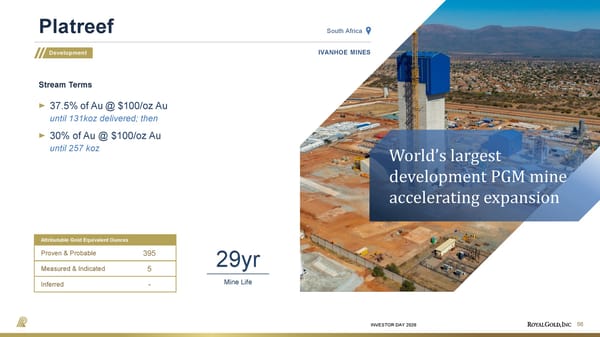
INVESTOR DAY 2026 Attributable Gold Equivalent Ounces Proven & Probable Measured & Indicated Inferred 29yr Platreef 56 Development IVANHOE MINES South Africa Stream Terms 37.5% of Au @ $100/oz Au until 131koz delivered; then 30% of Au @ $100/oz Au until 257 koz 395 5 - Mine Life World’s largest development PGM mine accelerating expansion
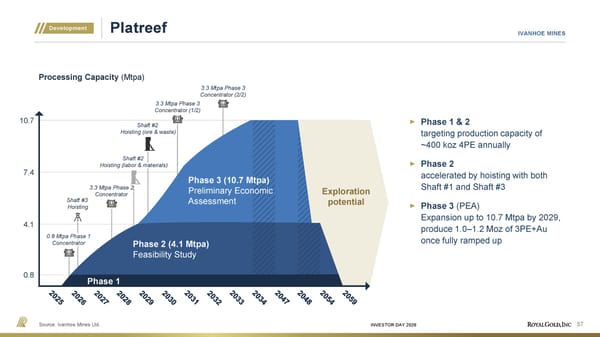
INVESTOR DAY 2026 0.8 4.1 7.4 10.7 Exploration potential Platreef 57 Source: Ivanhoe Mines Ltd. Development IVANHOE MINES Phase 1 & 2 targeting production capacity of ~400 koz 4PE annually Phase 2 accelerated by hoisting with both Shaft #1 and Shaft #3 Phase 3 (PEA) Expansion up to 10.7 Mtpa by 2029, produce 1.0–1.2 Moz of 3PE+Au once fully ramped up Processing Capacity (Mtpa) Phase 1 3.3 Mtpa Phase 3 Concentrator (2/2) 3.3 Mtpa Phase 3 Concentrator (1/2) Shaft #2 Hoisting (ore & waste) 3.3 Mtpa Phase 2 Concentrator Shaft #3 Hoisting Phase 2 (4.1 Mtpa) Feasibility Study Phase 3 (10.7 Mtpa) Preliminary Economic Assessment 0.8 Mtpa Phase 1 Concentrator Shaft #2 Hoisting (labor & materials)
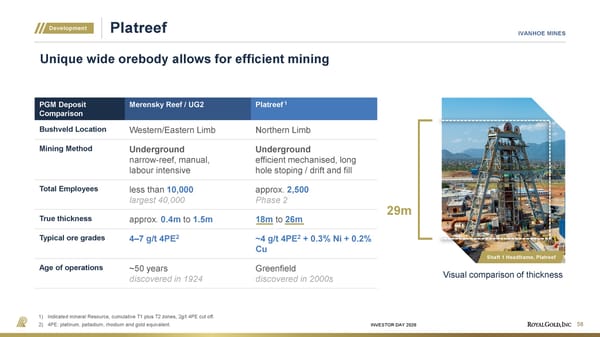
INVESTOR DAY 2026 Platreef 58 1) Indicated mineral Resource, cumulative T1 plus T2 zones, 2g/t 4PE cut off. 2) 4PE: platinum, palladium, rhodium and gold equivalent. Development IVANHOE MINES Unique wide orebody allows for efficient mining PGM Deposit Comparison Merensky Reef / UG2 Platreef 1 Bushveld Location Western/Eastern Limb Northern Limb Mining Method Underground narrow-reef, manual, labour intensive Underground efficient mechanised, long hole stoping / drift and fill Total Employees less than 10,000 largest 40,000 approx. 2,500 Phase 2 True thickness approx. 0.4m to 1.5m 18m to 26m Typical ore grades 4–7 g/t 4PE 2 ~4 g/t 4PE 2 + 0.3% Ni + 0.2% Cu Age of operations ~50 years discovered in 1924 Greenfield discovered in 2000s 29m Shaft 1 Headframe, Platreef Visual comparison of thickness
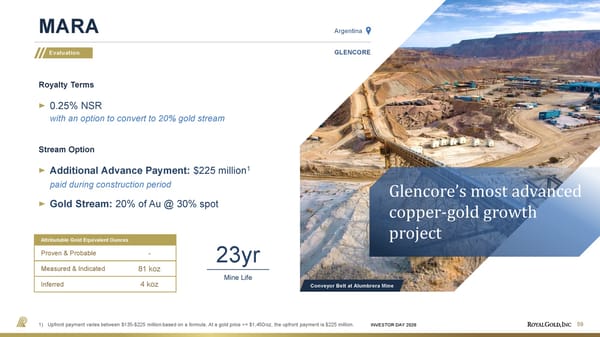
INVESTOR DAY 2026 Attributable Gold Equivalent Ounces Proven & Probable Measured & Indicated Inferred 23yr MARA 59 Evaluation GLENCORE Argentina Royalty Terms 0.25% NSR with an option to convert to 20% gold stream - 81 koz 4 koz Mine Life Glencore’s most advanced copper-gold growth project Additional Advance Payment: $225 million 1 paid during construction period Gold Stream: 20% of Au @ 30% spot Stream Option Conveyor Belt at Alumbrera Mine 1) Upfront payment varies between $135-$225 million based on a formula. At a gold price >= $1,450/oz, the upfront payment is $225 million.
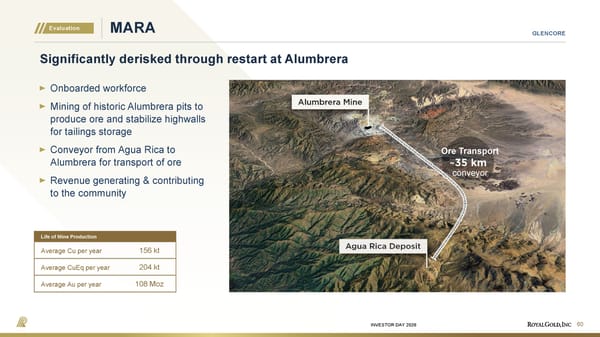
INVESTOR DAY 2026 MARA 60 Evaluation GLENCORE Significantly derisked through restart at Alumbrera Onboarded workforce Mining of historic Alumbrera pits to produce ore and stabilize highwalls for tailings storage Conveyor from Agua Rica to Alumbrera for transport of ore Revenue generating & contributing to the community Ore Transport conveyor Life of Mine Production Average Cu per year 156 kt Average CuEq per year 204 kt Average Au per year 108 Moz
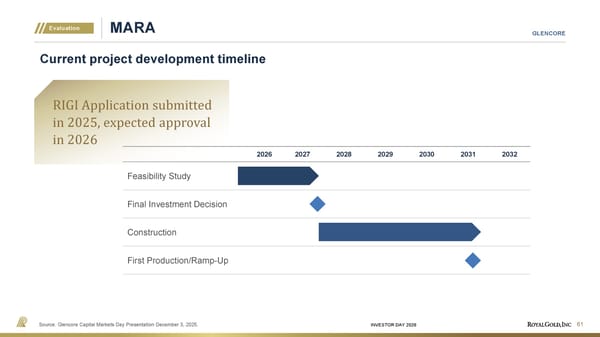
INVESTOR DAY 2026 MARA 61 Source: Glencore Capital Markets Day Presentation December 3, 2025. Evaluation GLENCORE Current project development timeline 2026 2027 2028 2029 2030 2031 2032 Feasibility Study Final Investment Decision Construction First Production/Ramp-Up RIGI Application submitted in 2025, expected approval in 2026
INVESTOR DAY 2026 Attributable Gold Equivalent Ounces Proven & Probable Measured & Indicated Inferred 12yr Great Bear 62 Evaluation KINROSS GOLD CORPORATION Ontario, Canada Royalty Terms 2.0% NSR - 54 koz 86 koz Mine Life World-class project is a centerpiece of Kinross’ development portfolio First 8 years Average Annual Production 500,000oz Au
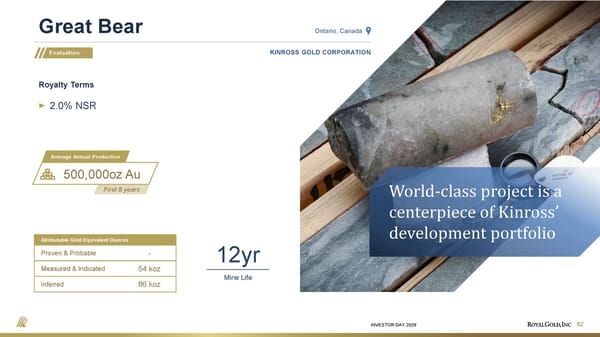
INVESTOR DAY 2026 Great Bear 63 Source: Kinross Gold Corporate March 2026 Investor Presentation. Evaluation KINROSS GOLD CORPORATION Conceptual project development timeline 2025 2026 2027 2028 2029 Advanced Exploration (AEX) Program Main Project 2026 Budget: $260M (AEX construction, detailed engineering & other) 2026 Focus: Advanced exploration decline development Main project detailed engineering and permitting Continue exploration from underground and on broader land package Construction Detailed Engineering and Procurement Exploration Decline Project Studies Early Works First Production
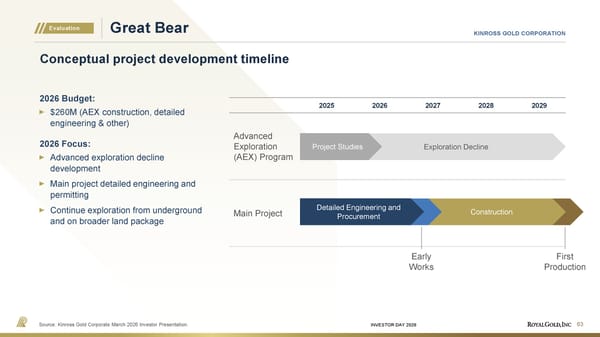
INVESTOR DAY 2026 Great Bear 64 Source: Kinross Investor Presentation March 2026. Evaluation KINROSS GOLD CORPORATION Multi-decade production potential 133 480 541 498 493 524 461 601 543 320 355 250 109 Annual Gold Production (koz) Underground Open Pit & Stockpiles Upside potential for additional underground resources at depth
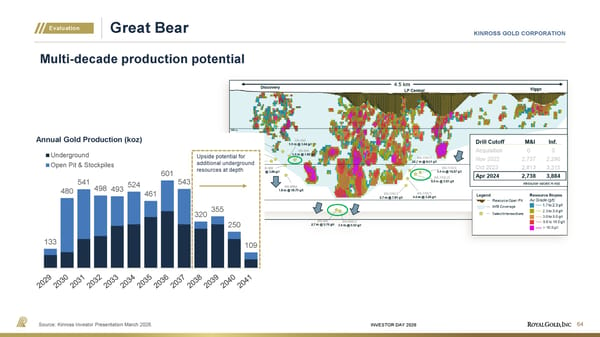
INVESTOR DAY 2026 Attributable Gold Equivalent Ounces Proven & Probable Measured & Indicated Inferred Warintza 65 Development SOLARIS RESOURCES Ecuador Stream Terms 20 oz Au per 1m lbs Cu produced @ 20% of spot increasing to 60% after 90koz Au delivered 162 koz 197 koz 99 koz Conceptual plan to extend mine life by an additional 25 to 30 Years Royalty Terms 0.3% – 0.6% NSR Measured 5,428 Indicated 6,392 Inferred 4,276 Reserves Resources (koz Au) Basis for PFS Mine Life 22yr Mine Life Solaris Resources Presentation January 2026.
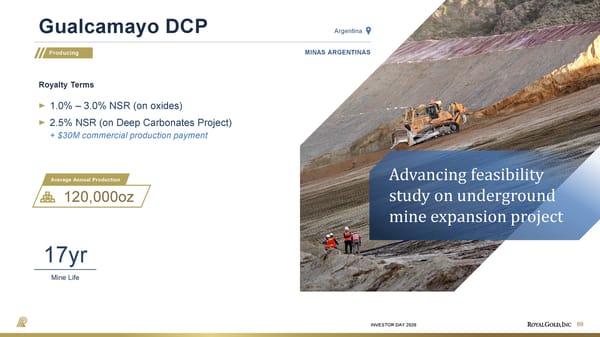
INVESTOR DAY 2026 Warintza 66 Solaris Resources Presentation January 2026. Development SOLARIS RESOURCES Project timeline US$200m Financing Package May 2025 ENAMI 2 Option Agreement Q1/26 Construction Period PFS Publication November 2025 EIA Technical Approval H1/26 2025 Updated MRE November 2025 Exploitation Agreement H2/26 Early Works to begin H2/26 Feasibility Study Publication H2/26 2027–2030 2026 2025 ~10,000 Au oz/year for the first 5 years of the stream ~8,000 Au oz/year for the first 15 years of the stream
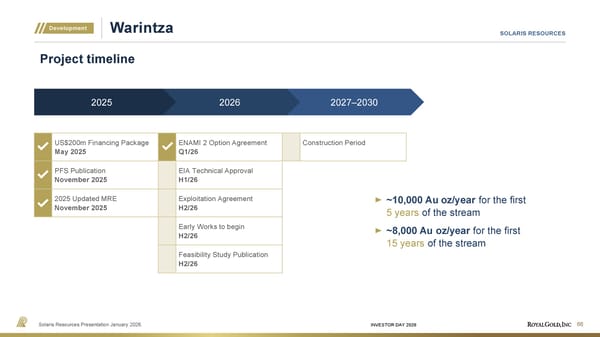
INVESTOR DAY 2026 Attributable Gold Equivalent Ounces Proven & Probable Measured & Indicated Inferred 22yr Cactus 67 Development ARIZONA SONORAN COPPER COMPANY Arizona, United States Royalty Terms 2.0% NSR (all metals) 78 koz 112 koz 39 koz Mine Life Past producing large copper porphyry project with long mine life Average Annual Production 198 mlbs Copper
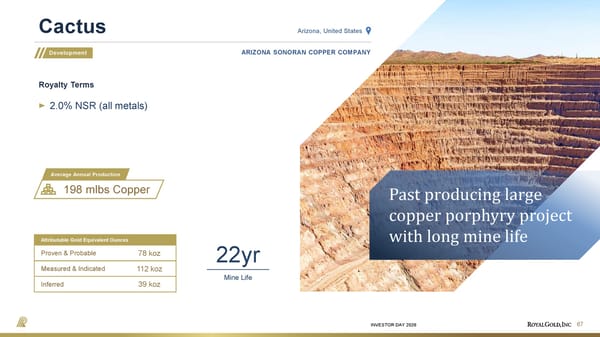
INVESTOR DAY 2026 Cactus 68 1) Source: Arizona Sonoran Copper Company Website, Maps & Figures. Development ARIZONA SONORAN COPPER COMPANY Mine life extension opportunities: Primary sulphides at depth Cactus East deposit Inclusion of inferred material through infill drilling to the M&I category NE Extension drilling
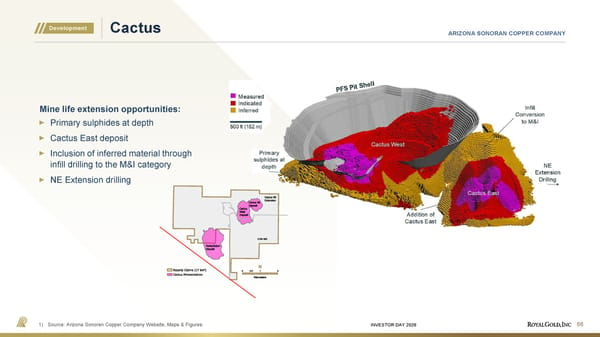
INVESTOR DAY 2026 Attributable Gold Equivalent Ounces Proven & Probable Measured & Indicated Inferred 69 Producing MINAS ARGENTINAS Argentina Royalty Terms 1.0% – 3.0% NSR (on oxides) 2.5% NSR (on Deep Carbonates Project) + $30M commercial production payment Advancing feasibility study on underground mine expansion project Average Annual Production 120,000oz 17yr Gualcamayo DCP Mine Life
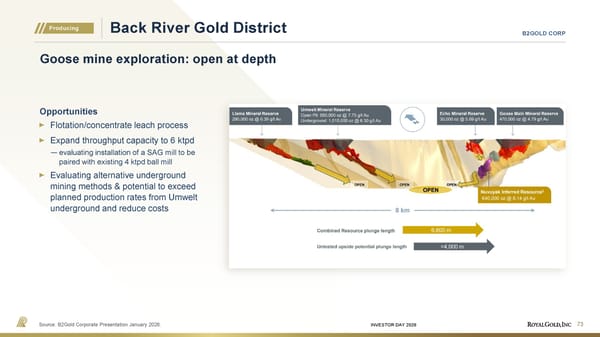
INVESTOR DAY 2026 2024 2025 2026 2027 2028 2029 2030 2031+ PEA Feasibility EIA + Permitting Construction Ramp-Up Operation Gualcamayo DCP 70 Producing MINAS ARGENTINAS RIGI approval in December 2025, first gold mining project to get approval 1) Asia Group Press Release, December 24, 2025.
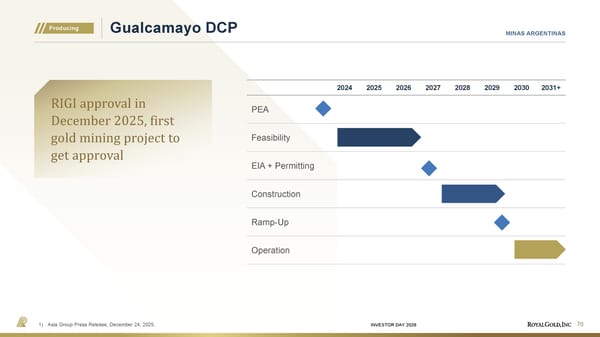
INVESTOR DAY 2026 Attributable Gold Equivalent Ounces Proven & Probable Measured & Indicated Inferred 9yr Back River Gold District 71 Producing B2GOLD CORP Nunavut, Canada Royalty Terms Goose: 3.3% approximate blended GSR George: 3.2% – 4.0% GSR (all metals) 51 koz 31 koz 8 koz Mine Life (Goose) New asset in production 2026–2031 Average Annual Production >300,000oz
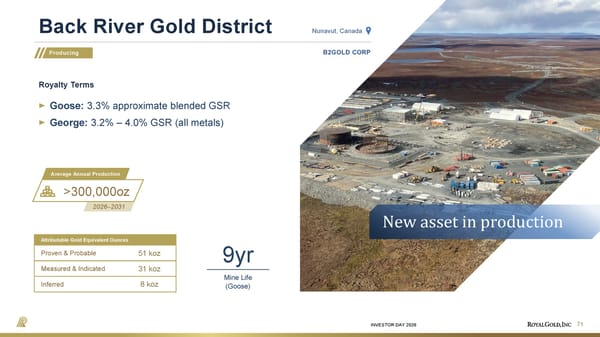
INVESTOR DAY 2026 Back River Gold District 72 Producing B2GOLD CORP Royalty rate ramps up in stages at Goose 0.7% NSR royalty rate until the receipt of C$5 million of royalty revenue, declining to 0.35% thereafter, on all gold produced from startup through to the cumulative production of 400,000 ounces; 2.5% GSR royalty rate on all gold produced after the cumulative production of 400,000 ounces up to a cumulative total of approx. 780,000 ounces; and 3.3% GSR royalty rate on all production above cumulative production of approximately 780,000 ounces. 0.7% NSR 2.5% G SR 3.3% G SR Goose
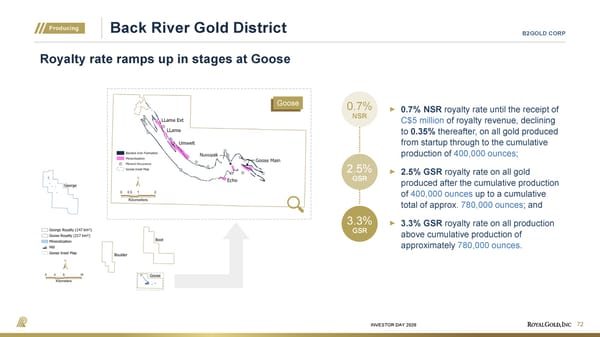
INVESTOR DAY 2026 Back River Gold District 73 Source: B2Gold Corporate Presentation January 2026. Producing B2GOLD CORP Goose mine exploration: open at depth Opportunities Flotation/concentrate leach process Expand throughput capacity to 6 ktpd — evaluating installation of a SAG mill to be paired with existing 4 ktpd ball mill Evaluating alternative underground mining methods & potential to exceed planned production rates from Umwelt underground and reduce costs
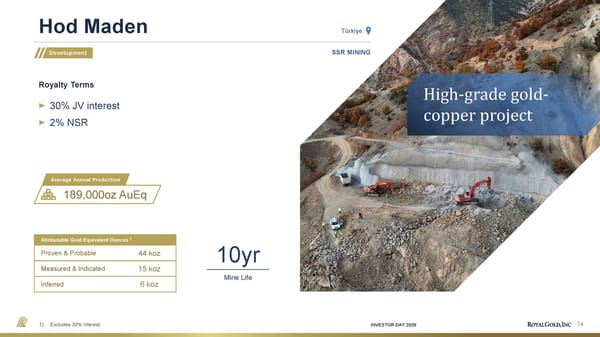
INVESTOR DAY 2026 Attributable Gold Equivalent Ounces Proven & Probable Measured & Indicated Inferred 10yr Hod Maden 74 Development SSR MINING Türkiye Royalty Terms 30% JV interest 2% NSR 44 koz 15 koz 6 koz Mine Life High-grade gold- copper project Average Annual Production 189,000oz AuEq 1) Excludes 30% interest. 1
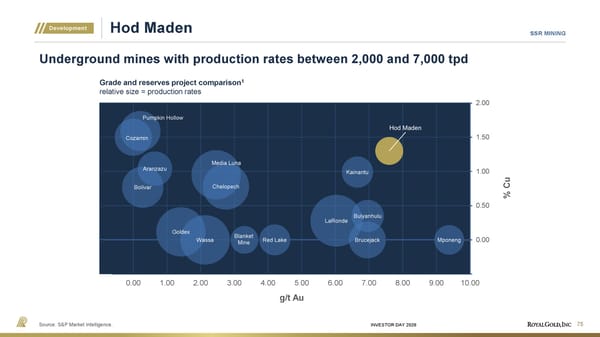
INVESTOR DAY 2026 Hod Maden 75 Source: S&P Market Intelligence. Development SSR MINING Underground mines with production rates between 2,000 and 7,000 tpd Goldex LaRonde Chelopech Media Luna Kainantu Mponeng Aranzazu Blanket Mine Bolivar Brucejack Bulyanhulu Cozamin Pumpkin Hollow Red Lake Hod Maden Wassa (0.50) 0.00 0.50 1.00 1.50 2.00 -1.00 0.00 1.00 2.00 3.00 4.00 5.00 6.00 7.00 8.00 9.00 10.00 % Cu g/t Au Grade and reserves project comparison 1 relative size = production rates
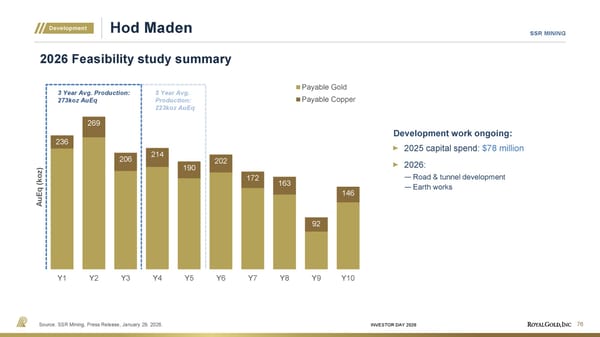
INVESTOR DAY 2026 Hod Maden 76 Source: SSR Mining, Press Release, January 29, 2026. Development SSR MINING 2026 Feasibility study summary Development work ongoing: 2025 capital spend: $78 million 2026: — Road & tunnel development — Earth works 236 269 206 214 190 202 172 163 92 146 Y1 Y2 Y3 Y4 Y5 Y6 Y7 Y8 Y9 Y10 AuEq (koz) Payable Gold Payable Copper 3 Year Avg. Production: 273koz AuEq 5 Year Avg. Production: 223koz AuEq
SPEAKER Capital Allocation and Growth Strategy Paul Libner | SVP and CFO Dan Breeze | SVP, Corporate Development, RGLD Gold AG 77 SPEAKERS
INVESTOR DAY 2026 Limit equity dilution Up to 3x Net Debt/EBITDA if we can reduce to 2x within one year Maintain ~$100M cash on hand Continue growing dividend Capital Allocation Priorities Royal Gold’s growth is based on a consistent approach with 3 priorities 1) December 31, 2025. 2) March 31, 2026. 3) Cash + undrawn Revolving Credit Facility. Maintain strong balance sheet and liquidity Return capital to shareholders Invest in accretive growth Lowest in GDX $1.90 per Share 0.8% Yield CURRENT LEVELS PARAMETERS 84.4M Shares Outstanding 25 consecutive years of growth 0.8x Net Debt/EBITDA 1 $600M Debt (~5% interest rate) 2 $224M Cash 1 ~$1B Available Liquidity 1,3 78
INVESTOR DAY 2026 Priorities Targets Considerations Invest in accretive growth Double-digit IRR over the long-term, limit equity dilution and show per share growth Each opportunity should provide accretive long-term return and improve portfolio quality Maintain strong balance sheet and liquidity $0 Debt with Revolving Credit Facility and cash on hand to fund opportunities Outstanding debt will be paid down and cash balance will build for investment in growth Return capital to shareholders Consistent dividend growth Regular Dividends Dividend raises consider assessment of future portfolio performance without formulaic targets Discretionary Special dividend / share buyback Considers cash balance, investment pipeline, trading valuation and relative returns Capital Allocation Framework Built-in flexibility and discretion as competing priorities change with market conditions 79
INVESTOR DAY 2026 80 Credit Facility is a Flexible and Strategic Financing Tool $0 $250 $500 $750 $1,000 $1,250 $1,500 2012 2013 2014 2015 2016 2017 2018 2019 2020 2021 2022 2023 2024 2025 Amount Drawn Total Available Credit Facility A low-cost instrument to provide liquidity and avoid dilution 1) As of December 31, 2025. Does not include a total of $300M revolver repayment made in the first quarter of 2026. 2) Net Debt/Adjusted EBITDA is a non-GAAP measure. See Appendix for additional information. Acquisitions: Pueblo Viejo Andacollo Wassa & Prestea Rainy River Repayment of convertible notes Precautionary draw at beginning of pandemic Acquisitions: Red Chris Xavantina Cote Acquisitions: Cortez Royalties (Rio Tinto and Idaho) Acquisitions: Kansanshi Sandstorm 0.79x Net Debt/ Adjusted EBITDA 2 $1.4B Increased as of August 5, 2025 Total Credit Facility Current Leverage 1 Figures shown in US$M
INVESTOR DAY 2026 81 Rapid Debt Repayment $775 $450 $900 $600 - $75 - $250 - $75 - $100 - $125 Outstanding at Sep. 30, 2025 Outstanding at Dec. 31, 2025 Outstanding at Mar. 31, 2026 Strengthens balance sheet and provides liquidity 1) The October 10 th , 2025 draw was for the close of the Sandstorm Gold and Horizon Copper transaction. Repayment November Repayment December Repayment January Repayment February Repayment March Draw 1 Oct. 10, 2025 $625M Total Repayments since October 20, 2025 Remaining balance expected to be repaid by early Q1 2027 At current metal prices and absent further portfolio additions Figures shown in US$M
INVESTOR DAY 2026 82 Streaming & Royalty Market is Growing 2025 was a record year for transactions & corporate M&A Source: Royal Gold, internal tracking files & Scotiabank. 2026 data includes transactions up to March 25, 2026. $1,032 $373 $2,151 $3,091 $1,443 $4,354 $1,924 $1,846 $2,270 $874 $3,132 $3,299 $3,340 $1,825 $3,305 $4,853 $6,013 $843 $98 $579 $99 $255 $41 $628 $1,357 $136 $183 $5,386 $1,874 $373 $2,151 $3,189 $2,023 $4,453 $1,924 $1,846 $2,270 $1,130 $3,173 $3,928 $4,697 $1,961 $3,488 $10,239 $6,013 2010 2011 2012 2013 2014 2015 2016 2017 2018 2019 2020 2021 2022 2023 2024 2025 2026 Industry Transactions Stream & Royalty Corporate Figures shown in US$M
INVESTOR DAY 2026 Scale Advantages Driving Market Leadership Source: Royal Gold, internal tracking files & Scotiabank. January 1, 2010 to March 25, 2026. Precious metal streaming/royalty financing greater than ~US$5M; excludes existing royalty/stream acquisitions. Big Three = RGLD, WPM, FNV. Mid Cap = TFPM, OSK, ORION, SAND (until its acquisition by RGLD in October 2025). 2022 includes $200M Hod Maden stream (SAND). Others includes Nomad (pre-SAND acquisition), OTPP, Sprott, Maverix (pre-TFPM acquisition), Altius, Gold Royalty, Sandbox/Versamet, Ecora, Zijin, Appian, Oaktree, LunR Royalties. 0% 20% 40% 60% 80% 100% 2010 2011 2012 2013 2014 2015 2016 2017 2018 2019 2020 2021 2022 2023 2024 2025 2026 Stream/Royalty Financing by Year Percentages based on transaction value ($) Big Three Mid Cap Others Major streaming and royalty companies benefiting from access to bigger deals and lower cost of capital 83
INVESTOR DAY 2026 Less than $100M $100M+ $200M+ $300M+ $400M+ $500M+ History of Stream Transactions from 2004 to 2026 1 Most stream transactions have been smaller than $300M with larger streams appearing in the last few years 84 Source: Royal Gold, internal tracking files. 1) January 1, 2004 to March 25, 2026. $185M $375M 2004-2022 2023-2026 Average Transaction Size 147 Total transactions 14 Balance sheet restructurings 7 Project development 1 Merger & acquisition 22 Transactions > $500M since 2004 40% transacted since 2020
INVESTOR DAY 2026 38% 35% 23% 4% 85 Financing Needs Balance sheet restructuring, development projects, expansion Mergers & Acquisitions Assist buyer through stream and royalty financing Third Party Stream and Royalty Sales Purchase existing streams and royalties from 3rd parties Sources of Transactions 1) Source: Royal Gold, internal tracking files & Scotiabank. January 1, 2010 to March 25, 2026. Project development Use of Proceeds 1 Balance sheet restructuring/ value arbitrage M&A Third party stream and royalty Sales
INVESTOR DAY 2026 Investment Criteria Business Development Process Continuously assess the opportunity against investment criteria People, project and place People Teams who can build and operate safely and sustainably for the benefit of all stakeholders Project Competitive cost position (post-investment); mine life and resource optionality providing exposure to multi-cycle cash flows; environmentally and socially sustainable plan Place Projects in communities that welcome sustainable mining, in countries open to foreign investment and with respect for the rule of law Strategic fit in existing Royal Gold portfolio Limit concentration risk, maintain gold bias Potential to generate cash flow for reinvestment and to grow shareholder returns Opportunities identified through inbound requests, internal initiatives and cultivating relationships Opportunity set monitored for changes that may upgrade investment prospect 1 2 86
INVESTOR DAY 2026 Evaluation and Execution Multi-step process can be completed quickly and efficiently 87 Technical, ESG, financial and legal Identify risks and opportunities Develop internal Life of Mine plan Determine optionality Recognize commodity price environment Risk profile determines discount rate Evaluate multiple scenarios Accretion to Royal Gold shareholders Be creative Share in optionality Protect Royal Gold’s interest Give operator flexibility to run their business Foster relationship for future investment opportunities Take a balanced commercial approach to reflect changing circumstances Support for operator community initiatives The investment process can be completed in as little as two to three months 100+ projects reviewed annually 0-3 typically close Ongoing Contract Management Transaction & Contract Structuring Financial Evaluation Due Diligence
INVESTOR DAY 2026 $0 $400 $800 $1,200 $1,600 USD Millions Stream & Royalty Transactions 1 88 Transaction Timing Can Be Unpredictable We need to be prepared for opportunities that may arise quickly 1) Royal Gold transactions including stream, royalty, and portfolio package acquisitions. Excludes corporate acquisitions. $4.1B Completed in 2025 Sandstorm/Horizon $0.7B Completed in 2010 IRC Corporate Transactions
INVESTOR DAY 2026 Partnership and Structuring Creativity is our competitive advantage, with no “one size fits all ” solution 89 Xavantina Incremental stream Kansanshi Gold stream structure Mount Milligan Long-term cost support Khoemaca u Financing package Select examples:
INVESTOR DAY 2026 Assets with Growth Potential Drive Returns Over Time Early conviction in assets has driven higher returns as value is daylighted 90 Source: Scotia Capital Research, included are 6 largest individual (ie. non-portfolio) acquisitions through 2025. 1) Refers to 2022 transactions for Rio Tinto Royalty ($525M) and for Idaho Royalty ($204M). 3.4% 7.1% 6.3% 14.4% 6.3% 11.7% 6.4% 11.5% 6.6% 12.2% 0.3% 4.6% Kansanshi Khoemaca u Andacollo Pueblo Viejo Mount Milligan Cortez IRR at January 2026 IRR at Deal Date <1yrs Time in Portfolio 6yrs Time in Portfolio 11yrs Time in Portfolio 11yrs Time in Portfolio 16yrs Time in Portfolio 4yrs 1 Time in Portfolio 2022 Transactions — Rio Tinto Royalty — Idaho Royalty
INVESTOR DAY 2026 Assets with Growth Potential Drive Returns Over Time Royal Gold has a record of adding value through investing in assets with growth potential 91 1) Consensus NAV (available analyst estimates) as of March 12, 2026. 2) Refers to Legacy Royalties only. Cash Flow Received end of 2025 Consensus NAV 1 Initial Investment $1,000 $26 $1,111 Kansanshi <1yrs Time in Portfolio $265 $112 $743 Khoemaca u 6yrs Time in Portfolio $525 $548 $779 Andacollo 11yrs Time in Portfolio $610 $671 $1,298 Pueblo Viejo 11yrs Time in Portfolio $782 $1,328 $2,179 Mount Milligan 16yrs Time in Portfolio $81 $729 $669 $924 Cortez 34yrs 2 Time in Portfolio $729M price paid for 2022 transactions: — Rio Tinto Royalty $525M — Idaho Royalty $204M Optionality from resource conversion is not always included in NAV estimates Figures shown in US$M
INVESTOR DAY 2026 $10,703 $370 $130 $0 $2,000 $4,000 $6,000 $8,000 $10,000 $12,000 Total Invested Capital Total Impairments excluding Pascua-Lama Royal Gold has invested ~$10.7B of capital in royalty and stream assets 1 Impairments have been limited over a long investing history Impairments account for ~1% of Total Invested Capital (excluding Pascua-Lama, which remains in the portfolio) Royal Gold is an effective steward of shareholder capital Our Investing Success Rate is High 1) As of December 31, 2025. Pascua-Lama, Phoenix Gold, and Wolverine account for 94% of Total Impairments Pascua-Lama royalty remains in our portfolio 92 USD Millions
SPEAKER Unique Attributes Alistair Baker | SVP, Investor Relations and Business Development Royal Gold Corp. 93
INVESTOR DAY 2026 US Domicile & Register Are Unique Source: NASDAQ, per 13-F filings; December 31, 2025 or as available. 1) As of December 31, 2025. Retail 13% Passive 43% Active 44% Top 5 41% Top 6 - 10 9% Top 11 - 20 9% Other Identifiable 28% Remainder (Retail) 13% Register Breakdown Dominant Orientation Only U.S. based precious metals streaming and royalty company 84.5M 1 Shares Outstanding Lowest in GDX 94
INVESTOR DAY 2026 Factor & strategy 2.9M Precious metals/mining 6.7M Major global equity indices 22.1M Shares held through indexer holdings 1 95 Key Index Inclusions S&P 400 CRSP US Total Market MarketVector Global Gold Miners Index Russell 1000 S&P US Completion MSCI Small Cap (US) Russell 3000 S&P Total Market Index Bloomberg 500 (added 2026) Royal Gold index inclusion across major equity benchmarks Sources of Passive Ownership 1. Source: TD Securities, estimated indexer holdings based on current index composition as of March 16, 2026. Royal Gold is included in over 250 indices globally
INVESTOR DAY 2026 Metals & Mining is Currently a Small Sector in the General Market Source: S&P US, SPDR S&P 500 ETF Trust. As at March 25, 2026. Information Technology 32.3% Financials 12.5% Communication Services 10.6% Consumer Discretionary 10.0% Health Care 9.8% Industrials 9.3% 5.4% Consumer Staples Energy 3.5% Utilities 2.5% Materials 2.2% 2.0% Chemicals 52.8% Metals & Mining 24.3% 9.8% Construction Materials 13.1% Containers & Packaging Freeport- McMoRan 31.9% Nucor & Steel Dynamics 22.5% Newmont 45.6% S&P 500 Sector Weightings S&P 500 Materials Sector S&P 500 Metals & Mining Newmont has a ~$110B 1 market cap and is ~0.24% of the S&P 500 96
INVESTOR DAY 2026 359 376 379 419 426 462 487 519 167 175 190 196 230 253 263 303 526 551 569 615 656 715 750 822 0 100 200 300 400 500 600 700 800 900 Q1 2024 Q2 2024 Q3 2024 Q4 2024 Q1 2025 Q2 2025 Q3 2025 Q4 2025 Active Passive 97 Institutional Holdings Increase in total number of shareholders Source: Rose & Company, Company Filings, Ipreo, and FactSet. 39.3M Shares Owned 55% of Total Institutional Holders Passive Investors Active Investors 133,360 Average Position 32.0M Shares Owned 45% of Total Institutional Holders 64,251 Average Position 21.0 yrs Weighted Average length of ownership 10.6 yrs Weighted Average length of ownership
INVESTOR DAY 2026 251 257 259 317 357 396 376 505 -215 -222 -232 -223 -240 -243 -308 -261 36 35 27 94 117 153 68 244 -350 -250 -150 -50 50 150 250 350 450 550 Q1 2024 Q2 2024 Q3 2024 Q4 2024 Q1 2025 Q2 2025 Q3 2025 Q4 2025 Buyers Sellers Net Change 98 Institutional Holdings More net buying than selling; mostly by active investors Source: Rose & Company, Company Filings, Ipreo, and FactSet.
INVESTOR DAY 2026 Q3 Q3 Q3 Q4 Q4 Q4 Q1 Q1 Q1 Q2 Q2 Q2 Q3 Q3 Q3 Q4 Q4 Q4 Q1 Q1 Q1 Q2 Q2 Q2 Q3 Q3 Q3 Q4 Q4 Q4 - 20 40 60 80 100 120 140 160 180 200 Amivest Liquidity 99 Royal Gold Shares are Highly Liquid Royal Gold is closing the liquidity gap amongst royalty larger peers Source: Nasdaq, Factset, market capitalization data as of March 25, 2026. 2023 2024 2025 Royal Gold $20B 2023 2024 2025 Franco Nevada $45B 2023 2024 2025 Wheaton PM $56B USD Value Traded (in millions) Associated with a 1% Change in Share Price +191% +54% +74%
INVESTOR DAY 2026 $53 $58 $50 $43 $44 $49 $48 $48 $60 $87 $137 $191 140 143 159 172 168 161 179 192 159 123 84 82 $0M $40M $80M $120M $160M $200M Q1 Q2 Q3 Q4 Q1 Q2 Q3 Q4 Q1 Q2 Q3 Q4 ADTV Turn of Float Liquidity Comparison On a relative-to-float basis, Royal Gold is more liquid than its large-cap peers 1. Source: TD Securities, Average daily trading volume is a 6-month average, calculated end of January 2026. in USD Millions Royal Gold Wheaton PM Franco-Nevada Market cap 1 $24,790 $67,803 $50,429 Average daily trading volume $302 $505 $363 # of days to turnover float 82 134 138 Royal Gold's liquidity profile improved significantly in the second half of 2025 2025 2024 2023 100
INVESTOR DAY 2026 101 Royal Gold is Currently Trading Well Below Peers RGLD $20B FNV $45B WPM $56B OR $7B TFPM $7B 10.0X 13.0X 16.0X 19.0X 22.0X 25.0X 1.0X 1.5X 2.0X 2.5X P/CF P/NAV We believe recent developments should help us capture higher multiples Source: CapIQ as of March 25, 2026.
SPEAKER Closing Commentary Bill Heissenbuttel | President and CEO 102
INVESTOR DAY 2026 103 Turning Headwinds Into Momentum: Subscale size relative to peers Consistent strategy of growth through acquisitions Asset concentration risk Most diversified portfolio amongst peers Limited long-term growth visibility Improved growth profile, provided 5-year guidance 2025 was Transformational for Royal Gold
CONCLUSION + Precious Metal Focused + High Quality Assets + Steady Return of Capital + Strong Balance Sheet + 80 Producing Assets + 364 Interests Spanning Many Jurisdictions + Most Diversified Portfolio in the Sector + 30 Development Assets + 250 Earlier-stage Assets + Leverage to the Gold Price Consistent Strategy Diversified Portfolio Embedded Growth
Appendix
INVESTOR DAY 2026 APPENDIX Overview of non-GAAP financial measures 106 Non-GAAP financial measures are intended to provide additional information only and do not have any standard meaning prescribed by U.S. generally accepted accounting principles (“GAAP”). These measures should not be considered in isolation or as a substitute for measures prepared in accordance with GAAP. In addition, because the presentation of these non-GAAP financial measures varies among companies, these non-GAAP financial measures may not be comparable to similarly titled measures used by other companies. We have provided below reconciliations of our non-GAAP financial measures to the comparable GAAP measures. We believe these non-GAAP financial measures provide useful information to investors for analysis of our business. We use these non-GAAP financial measures to compare period-over-period performance on a consistent basis and when planning and forecasting for future periods. We believe these non-GAAP financial measures are used by professional research analysts and others in the valuation, comparison and investment recommendations of companies in our industry. Many investors use the published research reports of these professional research analysts and others in making investment decisions. The adjustments made to calculate our non-GAAP financial measures are subjective and involve significant management judgement. Non-GAAP financial measures used by management in this presentation or elsewhere include the following: 1. Adjusted earnings before interest, taxes, depreciation, depletion and amortization, or adjusted EBITDA, is a non-GAAP financial measure that is calculated by the Company as net income adjusted for certain items that impact the comparability of results from period to period, as set forth in the reconciliation below. The net income and adjusted EBITDA margins represent net income or adjusted EBITDA divided by total revenue. We consider adjusted EBITDA to be useful because the measure reflects our operating performance before the effects of certain non-cash items and other items that we believe are not indicative of our core operations. 2. Cash general and administrative expense, or cash G&A, is a non-GAAP financial measure that is calculated by the Company as general and administrative expenses for a period minus non-cash employee stock compensation expense for the same period. Cash G&A margin represents cash G&A divided by total revenue. We believe that cash G&A is useful as an indicator of overhead efficiency without regard to non-cash expenses associated with employee stock compensation. NON-GAAP MEASURES
INVESTOR DAY 2026 APPENDIX Reconciliation of non-GAAP financial measures to U.S. GAAP measures 107 Adjusted EBITDA and Adjusted EBITDA margin: NON-GAAP MEASURES (amounts in thousands) Net income (loss) $ 471,576 $ 332,479 $ 240,132 $ 239,942 $ 274,940 $ 253,626 Depreciation, depletion and amortization 177,082 144,426 164,937 178,935 189,009 190,869 Non-cash employee stock compensation 11,805 11,892 9,696 8,411 6,056 8,368 Acquisition related costs 26,508 -- -- -- -- -- Impairment of royalty interests -- -- -- 4,287 -- 1,341 Gain on sale of Peak Gold JV interest -- -- -- -- -- (33,906) Fair value changes in equity securities (327) 66 147 1,503 (2,510) (4,728) Loss on sale of marketable securities 50,017 -- -- -- -- -- Other non-recurring adjustments -- -- 2,440 -- -- -- Interest and other, net 14,611 3,741 20,915 9,338 2,734 6,136 Income tax expense 102,290 93,613 42,008 32,926 53,223 22,401 Non-controlling interests in operating income of consolidated subsidiaries (5,295) (456) (692) (960) (898) 919 Adjusted EBITDA $ 848,267 $ 585,760 $ 479,583 $ 474,382 $ 522,554 $ 445,026 Revenue 1,030,471 719,395 605,717 603,206 653,568 561,643 Adjusted EBITDA Margin 82% 81% 79% 79% 80% 79% Debt $ 895,436 Debt Issuance costs 4,564 Cash and equivalent (233,719) Net debt/ (cash) 666,281 Net debt/ (cash) to Adjusted EBITDA 0.79X Tw elve Months Ended Decem ber 31, 2025 2024 2021 2023 2020 2022
INVESTOR DAY 2026 APPENDIX Reconciliation of non-GAAP financial measures to U.S. GAAP measures 108 Cash G&A and Cash G&A Margin: NON-GAAP MEASURES (amounts in thousands) General and administrative expense $ 49,183 $ 40,934 $ 39,761 $ 34,612 $ 29,306 $ 30,331 Non-cash employee stock compensation (11,805) (11,892) (9,696) (8,411) (6,056) (8,368) Cash G&A $ 37,378 $ 29,042 $ 30,065 $ 26,201 $ 23,250 $ 21,963 Revenue 1,030,471 719,395 605,717 603,206 653,568 561,643 Cash G&A Margin 4% 4% 5% 4% 4% 4% 2025 2024 Tw elve Months Ended Decem ber 31, 2020 2023 2022 2021
INVESTOR DAY 2026 APPENDIX 109 DD&A RATES PRINCIPAL PROPERTIES Commodity Current Stream / Royalty Rate Depletion Rate Mount Milligan Gold 35% $223/oz Au Copper 18.75% $0.48/lb Cu Cortez (blended rate) Gold 3.5-4.0% GSR $1,269/oz Au Pueblo Viejo Gold 7.5% $283/oz Au Silver 75% $2.70/oz Ag Andacollo Gold 100% $463/oz Au Kansanshi Gold 75 ounces of gold per 1 million lbs of Cu $1,787/oz Au Royal Gold has included the DD&A rates for the Principal Properties. The guidance for total DD&A for 2026 is $339- 379M.
INVESTOR DAY 2026 APPENDIX We use certain other measures in managing and evaluating our business. We believe these measures may provide useful information to investors for analysis of our business. We use these measures to compare period-over-period performance and liquidity on a consistent basis and when planning and forecasting for future periods. We believe these measures are used by professional research analysts and others in the valuation, comparison, and investment recommendations of companies in our industry. Many investors use the published research reports of these professional research analysts and others in making investment decisions. Other measures used by management in this presentation and elsewhere include the following: 1. Gold equivalent ounces, or GEOs, is calculated by the Company as revenue (in total or by reportable segment) for a period divided by the average LBMA PM fixing price for gold for that same period. 2. Depreciation, depletion, and amortization, or DD&A, per GEO is calculated by the Company as depreciation, depletion, and amortization for a period divided by GEOs (as defined above) for that same period. 3. Working capital is calculated by the Company as current assets as of a date minus current liabilities as of that same date. Liquidity is calculated by the Company as working capital plus available capacity under the Company’s revolving credit facility. 4. Dividend payout ratio is calculated by the Company as dividends paid during a period divided by net cash provided by operating activities for that same period. CERTAIN OTHER MEASURES 110
+1 303 573 1660 WEB investorrelations@royalgold.com DIRECT EMAIL www.royalgold.com