
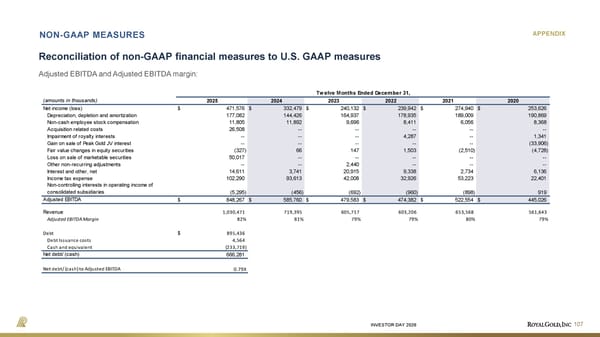
INVESTOR DAY 2026 APPENDIX Reconciliation of non-GAAP financial measures to U.S. GAAP measures 107 Adjusted EBITDA and Adjusted EBITDA margin: NON-GAAP MEASURES (amounts in thousands) Net income (loss) $ 471,576 $ 332,479 $ 240,132 $ 239,942 $ 274,940 $ 253,626 Depreciation, depletion and amortization 177,082 144,426 164,937 178,935 189,009 190,869 Non-cash employee stock compensation 11,805 11,892 9,696 8,411 6,056 8,368 Acquisition related costs 26,508 -- -- -- -- -- Impairment of royalty interests -- -- -- 4,287 -- 1,341 Gain on sale of Peak Gold JV interest -- -- -- -- -- (33,906) Fair value changes in equity securities (327) 66 147 1,503 (2,510) (4,728) Loss on sale of marketable securities 50,017 -- -- -- -- -- Other non-recurring adjustments -- -- 2,440 -- -- -- Interest and other, net 14,611 3,741 20,915 9,338 2,734 6,136 Income tax expense 102,290 93,613 42,008 32,926 53,223 22,401 Non-controlling interests in operating income of consolidated subsidiaries (5,295) (456) (692) (960) (898) 919 Adjusted EBITDA $ 848,267 $ 585,760 $ 479,583 $ 474,382 $ 522,554 $ 445,026 Revenue 1,030,471 719,395 605,717 603,206 653,568 561,643 Adjusted EBITDA Margin 82% 81% 79% 79% 80% 79% Debt $ 895,436 Debt Issuance costs 4,564 Cash and equivalent (233,719) Net debt/ (cash) 666,281 Net debt/ (cash) to Adjusted EBITDA 0.79X Tw elve Months Ended Decem ber 31, 2025 2024 2021 2023 2020 2022
 Investor Day Presentation Page 106 Page 108