
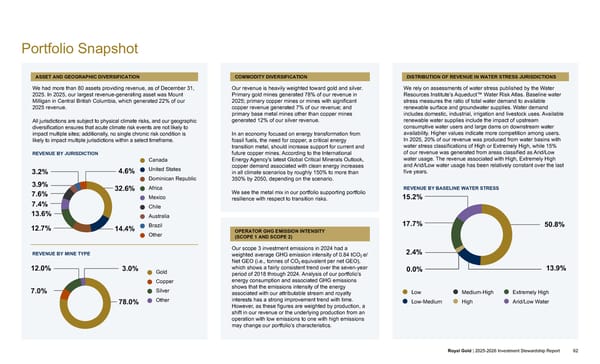
Portfolio Snapshot ASSET AND GEOGRAPHIC DIVERSIFICATION We had more than 80 assets providing revenue, as of December 31, 2025. In 2025, our largest revenue-generating asset was Mount Milligan in Central British Columbia, which generated 22% of our 2025 revenue. All jurisdictions are subject to physical climate risks, and our geographic diversification ensures that acute climate risk events are not likely to impact multiple sites; additionally, no single chronic risk condition is likely to impact multiple jurisdictions within a select timeframe. REVENUE BY JURISDICTION 3.2% 3.9% 7.4% 32.6% 14.4% 7.6% 12.7% 13.6% 4.6% 🟇 Canada 🟇 United States 🟇 Dominican Republic 🟇 Africa 🟇 Mexico 🟇 Chile 🟇 Australia 🟇 Brazil 🟇 Other REVENUE BY MINE TYPE 3.0% 12.0% 7.0% 78.0% 🟇 Gold 🟇 Copper 🟇 Silver 🟇 Other COMMODITY DIVERSIFICATION Our revenue is heavily weighted toward gold and silver. Primary gold mines generated 78% of our revenue in 2025; primary copper mines or mines with significant copper revenue generated 7% of our revenue; and primary base metal mines other than copper mines generated 12% of our silver revenue. In an economy focused on energy transformation from fossil fuels, the need for copper, a critical energy transition metal, should increase support for current and future copper mines. According to the International Energy Agency's latest Global Critical Minerals Outlook, copper demand associated with clean energy increases in all climate scenarios by roughly 150% to more than 350% by 2050, depending on the scenario. We see the metal mix in our portfolio supporting portfolio resilience with respect to transition risks. OPERATOR GHG EMISSION INTENSITY (SCOPE 1 AND SCOPE 2) Our scope 3 investment emissions in 2024 had a weighted average GHG emission intensity of 0.84 tCO 2 e/ Net GEO (i.e., tonnes of CO 2 equivalent per net GEO), which shows a fairly consistent trend over the seven-year period of 2018 through 2024. Analysis of our portfolio’s energy consumption and associated GHG emissions shows that the emissions intensity of the energy associated with our attributable stream and royalty interests has a strong improvement trend with time. However, as these figures are weighted by production, a shift in our revenue or the underlying production from an operation with low emissions to one with high emissions may change our portfolio’s characteristics. DISTRIBUTION OF REVENUE IN WATER STRESS JURISDICTIONS We rely on assessments of water stress published by the Water Resources Institute’s Aqueduct™ Water Risk Atlas. Baseline water stress measures the ratio of total water demand to available renewable surface and groundwater supplies. Water demand includes domestic, industrial, irrigation and livestock uses. Available renewable water supplies include the impact of upstream consumptive water users and large dams on downstream water availability. Higher values indicate more competition among users. In 2025, 20% of our revenue was produced from water basins with water stress classifications of High or Extremely High, while 15% of our revenue was generated from areas classified as Arid/Low water usage. The revenue associated with High, Extremely High and Arid/Low water usage has been relatively constant over the last five years. REVENUE BY BASELINE WATER STRESS INTRODUCTION ABOUT ROYAL GOLD GOVERNANCE OUR PEOPLE OPERATORS AND COMMUNITIES INVESTMENT STEWARDSHIP APPENDICES Royal Gold | 2025-2026 Investment Stewardship Report 62 50.8% 13.9% 2.4% 17.7% 0.0% 15.2% 🟇 Low 🟇 Medium-High 🟇 Extremely High 🟇 Low-Medium 🟇 High 🟇 Arid/Low Water
 2025–2026 Investment Stewardship Report Page 61 Page 63