
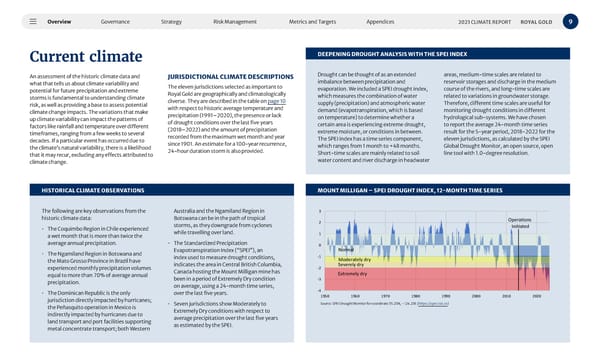
Overview Governance Strategy Risk Management Metrics and Targets Appendices 9 2023 CLIMATE REPORT ROYAL GOLD Current climate An assessment of the historic climate data and what that tells us about climate variability and potential for future precipitation and extreme storms is fundamental to understanding climate risk, as well as providing a base to assess potential climate change impacts. The variations that make up climate variability can impact the patterns of factors like rainfall and temperature over different timeframes, ranging from a few weeks to several decades. If a particular event has occurred due to the climate’s natural variability, there is a likelihood that it may recur, excluding any effects attributed to climate change. JURISDICTIONAL CLIMATE DESCRIPTIONS The eleven jurisdictions selected as important to Royal Gold are geographically and climatologically diverse. They are described in the table on page 10 with respect to historic average temperature and precipitation (1991–2020), the presence or lack of drought conditions over the last five years (2018–2022) and the amount of precipitation recorded from the maximum wet month and year since 1901. An estimate for a 100-year recurrence, 24-hour duration storm is also provided. DEEPENING DROUGHT ANALYSIS WITH THE SPEI INDEX Drought can be thought of as an extended imbalance between precipitation and evaporation. We included a SPEI drought index, which measures the combination of water supply (precipitation) and atmospheric water demand (evapotranspiration, which is based on temperature) to determine whether a certain area is experiencing extreme drought, extreme moisture, or conditions in between. The SPEI index has a time series component, which ranges from 1 month to +48 months. Short-time scales are mainly related to soil water content and river discharge in headwater areas, medium-time scales are related to reservoir storages and discharge in the medium course of the rivers, and long-time scales are related to variations in groundwater storage. Therefore, different time scales are useful for monitoring drought conditions in different hydrological sub-systems. We have chosen to report the average 24-month time series result for the 5-year period, 2018-2022 for the eleven jurisdictions, as calculated by the SPEI Global Drought Monitor, an open source, open line tool with 1.0-degree resolution. HISTORICAL CLIMATE OBSERVATIONS The following are key observations from the historic climate data: • The Coquimbo Region in Chile experienced a wet month that is more than twice the average annual precipitation. • The Ngamiland Region in Botswana and the Mato Grosso Province in Brazil have experienced monthly precipitation volumes equal to more than 70% of average annual precipitation. • The Dominican Republic is the only jurisdiction directly impacted by hurricanes; the Peñasquito operation in Mexico is indirectly impacted by hurricanes due to land transport and port facilities supporting metal concentrate transport; both Western Australia and the Ngamiland Region in Botswana can be in the path of tropical storms, as they downgrade from cyclones while travelling over land. • The Standardized Precipitation Evapotranspiration Index (“SPEI”), an index used to measure drought conditions, indicates the area in Central British Columbia, Canada hosting the Mount Milligan mine has been in a period of Extremely Dry condition on average, using a 24-month time series, over the last five years. • Seven jurisdictions show Moderately to Extremely Dry conditions with respect to average precipitation over the last five years as estimated by the SPEI. MOUNT MILLIGAN – SPEI DROUGHT INDEX, 12-MONTH TIME SERIES -4 -3 -2 -1 0 1 2 3 1950 1960 1970 1980 1990 2000 2010 2020 Mount Milligan - SPEI Drought Index, 12 month time - series Normal Moderately dry Severely dry Extremely dry Operations Initiated Source: SPEI Drought Monitor for coordinate 55.25N, - 124.25E (https://spei.csic.es) Source: SPEI Drought Monitor for coordinate 55.25N, –124.25E ( https://spei.csic.es )
 2023 Climate Report Page 8 Page 10