
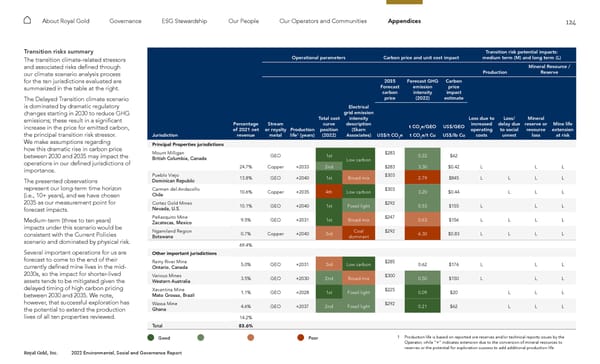
124 Royal Gold, Inc. 2022 Environmental, Social and Governance Report About Royal Gold Governance ESG Stewardship Our People Our Operators and Communities Appendices Transition risks summary The transition climate-related stressors and associated risks defined through our climate scenario analysis process for the ten jurisdictions evaluated are summarized in the table at the right. The Delayed Transition climate scenario is dominated by dramatic regulatory changes starting in 2030 to reduce GHG emissions; these result in a significant increase in the price for emitted carbon, the principal transition risk stressor. We make assumptions regarding how this dramatic rise in carbon price between 2030 and 2035 may impact the operations in our defined jurisdictions of importance. The presented observations represent our long-term time horizon (i.e., 10+ years), and we have chosen 2035 as our measurement point for forecast impacts. Medium-term (three to ten years) impacts under this scenario would be consistent with the Current Policies scenario and dominated by physical risk. Several important operations for us are forecast to come to the end of their currently defined mine lives in the mid- 2030s, so the impact for shorter-lived assets tends to be mitigated given the delayed timing of high carbon pricing between 2030 and 2035. We note, however, that successful exploration has the potential to extend the production lives of all ten properties reviewed. Operational parameters Carbon price and unit cost impact Transition risk potential impacts: medium term (M) and long term (L) Production Mineral Resource / Reserve 2035 Forecast carbon price Forecast GHG emission intensity (2022) Carbon price impact estimate Jurisdiction Percentage of 2021 net revenue Stream or royalty metal Production life 1 (years) Total cost curve position (2022) Electrical grid emission intensity description (Skarn Associates) US$/t CO 2 e t CO 2 e/GEO t CO 2 e/t Cu US$/GEO US$/lb Cu Loss due to increased operating costs Loss/ delay due to social unrest Mineral reserve or resource loss Mine life extension at risk Principal Properties jurisdictions Mount Milligan British Columbia, Canada GEO 1st Low carbon $283 0.22 $62 24.7% Copper +2033 2nd $283 3.30 $0.42 L L L Pueblo Viejo Dominican Republic 13.8% GEO +2040 1st Broad mix $303 2.79 $845 L L L L Carmen del Andacollo Chile 10.6% Copper +2035 4th Low carbon $303 3.20 $0.44 L L L Cortez Gold Mines Nevada, U.S. 10.1% GEO +2040 1st Fossil light $292 0.53 $155 L L L Peñasquito Mine Zacatecas, Mexico 9.5% GEO +2031 1st Broad mix $247 0.63 $156 L L L L Ngamiland Region Botswana 0.7% Copper +2040 3rd Coal dominant $292 6.30 $0.83 L L L L 69.4% Other important jurisdictions Rainy River Mine Ontario, Canada 5.0% GEO +2031 3rd Low carbon $285 0.62 $176 L L L Various Mines Western Australia 3.5% GEO +2030 2nd Broad mix $300 0.50 $150 L L L Xavantina Mine Mato Grosso, Brazil 1.1% GEO +2028 1st Fossil light $225 0.09 $20 L L L Wassa Mine Ghana 4.6% GEO +2037 2nd Fossil light $292 0.21 $62 L L L 14.2% Total 83.6% 1 Production life is based on reported ore reserves and/or technical reports issues by the Operator, while “+” indicates extension due to the conversion of mineral resources to reserves or the potential for exploration success to add additional production life Good Poor
 2022 ESG Report Page 123 Page 125