
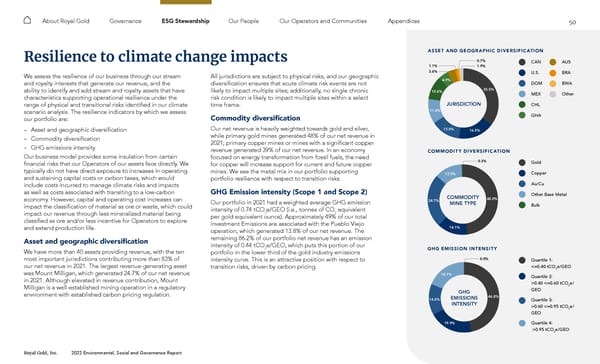
50 Royal Gold, Inc. 2022 Environmental, Social and Governance Report About Royal Gold Governance ESG Stewardship Our People Our Operators and Communities Appendices CAN U.S. DOM MEX CHL GHA AUS BRA BWA Other Resilience to climate change impacts We assess the resilience of our business through our stream and royalty interests that generate our revenue, and the ability to identify and add stream and royalty assets that have characteristics supporting operational resilience under the range of physical and transitional risks identified in our climate scenario analysis. The resilience indicators by which we assess our portfolio are: – Asset and geographic diversification – Commodity diversification – GHG emissions intensity Our business model provides some insulation from certain financial risks that our Operators of our assets face directly. We typically do not have direct exposure to increases in operating and sustaining capital costs or carbon taxes, which would include costs incurred to manage climate risks and impacts as well as costs associated with transiting to a low-carbon economy. However, capital and operating cost increases can impact the classification of material as ore or waste, which could impact our revenue through less mineralized material being classified as ore and/or less incentive for Operators to explore and extend production life. Asset and geographic diversification We have more than 40 assets providing revenue, with the ten most important jurisdictions contributing more than 83% of our net revenue in 2021. The largest revenue-generating asset was Mount Milligan, which generated 24.7% of our net revenue in 2021. Although elevated in revenue contribution, Mount Milligan is a well-established mining operation in a regulatory environment with established carbon pricing regulation. All jurisdictions are subject to physical risks, and our geographic diversification ensures that acute climate risk events are not likely to impact multiple sites; additionally, no single chronic risk condition is likely to impact multiple sites within a select time frame. Commodity diversification Our net revenue is heavily weighted towards gold and silver, while primary gold mines generated 48% of our net revenue in 2021; primary copper mines or mines with a significant copper revenue generated 39% of our net revenue. In an economy focused on energy transformation from fossil fuels, the need for copper will increase support for current and future copper mines. We see the metal mix in our portfolio supporting portfolio resilience with respect to transition risks. GHG Emission intensity (Scope 1 and Scope 2) Our portfolio in 2021 had a weighted average GHG emission intensity of 0.74 tCO 2 e/GEO (i.e., tonnes of CO 2 equivalent per gold equivalent ounce). Approximately 49% of our total Investment Emissions are associated with the Pueblo Viejo operation, which generated 13.8% of our net revenue. The remaining 86.2% of our portfolio net revenue has an emission intensity of 0.44 tCO 2 e/GEO, which puts this portion of our portfolio in the lower third of the gold industry emissions intensity curve. This is an attractive position with respect to transition risks, driven by carbon pricing. Quartile 1: <=0.40 tCO 2 e/GEO Quartile 2: >0.40 <=0.60 tCO 2 e/ GEO Quartile 3: >0.60 <=0.95 tCO 2 e/ GEO Quartile 4: >0.95 tCO 2 e/GEO Gold Copper Au/Cu Other Base Metal Bulk A SSET AND GEOGR APHIC DIVER SIFIC ATION 35.5% 16.5% 13.8% 11.4% 10.6% 4.9% 1.9% 0.7% 3.6% 1.1% JURISDICTION CAN USA DOM MEX CHL GHA AUS BRA BWA Other COMMODIT Y DIVER SIFIC ATION 48.0% 14.1% 24.7% 12.9% 0.3% COMMODITY MINE TYPE Gold Copper Au/Cu Other Base Metal Bulk GHG EMISSION INTENSIT Y 46.8% 19.9% 14.6% 18.7% 0.0% GHG EMISSIONS INTENSITY 1st Quartile 2nd Quartile 3rd Quartile 4th Quartile NA
 2022 ESG Report Page 49 Page 51