
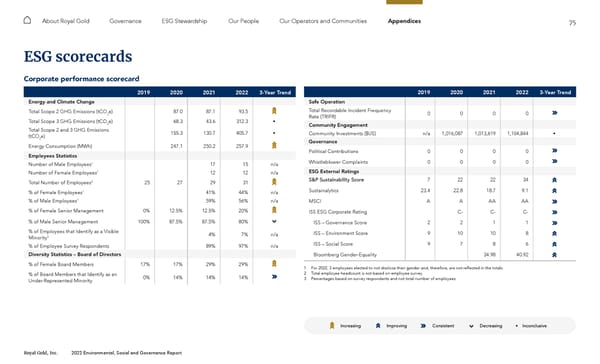
75 Royal Gold, Inc. 2022 Environmental, Social and Governance Report About Royal Gold Governance ESG Stewardship Our People Our Operators and Communities Appendices ESG scorecards Corporate performance scorecard 2019 2020 2021 2022 3-Year Trend Energy and Climate Change Total Scope 2 GHG Emissions (tCO 2 e) 87.0 87.1 93.5 Total Scope 3 GHG Emissions (tCO 2 e) 68.3 43.6 312.3 • Total Scope 2 and 3 GHG Emissions (tCO 2 e) 155.3 130.7 405.7 • Energy Consumption (MWh) 247.1 250.2 257.9 Employees Statistics Number of Male Employees 1 17 15 n/a Number of Female Employees 1 12 12 n/a Total Number of Employees 2 25 27 29 31 % of Female Employees 1 41% 44% n/a % of Male Employees 1 59% 56% n/a % of Female Senior Management 0% 12.5% 12.5% 20% % of Male Senior Management 100% 87.5% 87.5% 80% % of Employees that Identify as a Visible Minority 3 4% 7% n/a % of Employee Survey Respondents 89% 97% n/a Diversity Statistics – Board of Directors % of Female Board Members 17% 17% 29% 29% % of Board Members that Identify as an Under-Represented Minority 0% 14% 14% 14% 2019 2020 2021 2022 3-Year Trend Safe Operation Total Recordable Incident Frequency Rate (TRIFR) 0 0 0 0 Community Engagement Community Investments ($US) n/a 1,016,087 1,013,619 1,104,844 • Governance Political Contributions 0 0 0 0 Whistleblower Complaints 0 0 0 0 ESG External Ratings S&P Sustainability Score 7 22 22 34 Sustainalytics 23.4 22.8 18.7 9.1 MSCI A A AA AA ISS ESG Corporate Rating C- C- C- ISS – Governance Score 2 2 1 1 ISS – Environment Score 9 10 10 8 ISS – Social Score 9 7 8 6 Bloomberg Gender-Equality 34.98 40.92 1 For 2022, 3 employees elected to not disclose their gender and, therefore, are not reflected in the totals. 2 Total employee headcount is not based on employee survey. 3 Percentages based on survey respondents and not total number of employees. Increasing Improving Consistent Decreasing • Inconclusive
 2022 ESG Report Page 74 Page 76