
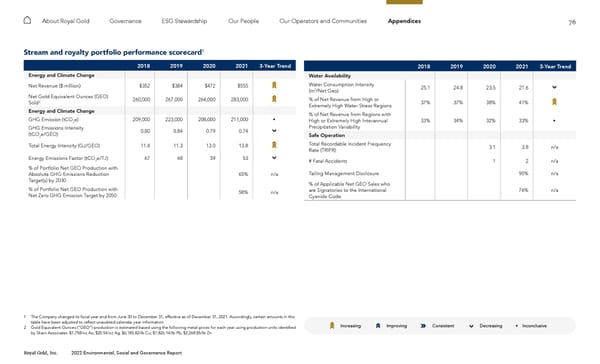
76 Royal Gold, Inc. 2022 Environmental, Social and Governance Report About Royal Gold Governance ESG Stewardship Our People Our Operators and Communities Appendices Stream and royalty portfolio performance scorecard 1 2018 2019 2020 2021 3-Year Trend Energy and Climate Change Net Revenue ($ million) $352 $384 $472 $555 Net Gold Equivalent Ounces (GEO) Sold 2 260,000 267,000 264,000 283,000 Energy and Climate Change GHG Emission (tCO 2 e) 209,000 223,000 208,000 211,000 • GHG Emissions Intensity (tCO 2 e/GEO) 0.80 0.84 0.79 0.74 Total Energy Intensity (GJ/GEO) 11.4 11.3 13.0 13.8 Energy Emissions Factor (tCO 2 e/TJ) 67 68 59 53 % of Portfolio Net GEO Production with Absolute GHG Emissions Reduction Target(s) by 2030 65% n/a % of Portfolio Net GEO Production with Net Zero GHG Emission Target by 2050 58% n/a Increasing Improving Consistent Decreasing • Inconclusive 2018 2019 2020 2021 3-Year Trend Water Availability Water Consumption Intensity (m 3 /Net Geo) 25.1 24.8 23.5 21.6 % of Net Revenue from High or Extremely High Water Stress Regions 37% 37% 38% 41% % of Net Revenue from Regions with High or Extremely High Interannual Precipitation Variability 33% 34% 32% 33% • Safe Operation Total Recordable Incident Frequency Rate (TRIFR) 3.1 3.8 n/a # Fatal Accidents 1 2 n/a Tailing Management Disclosure 90% n/a % of Applicable Net GEO Sales who are Signatories to the International Cyanide Code 76% n/a 1 The Company changed its fiscal year end from June 30 to December 31, effective as of December 31, 2021. Accordingly, certain amounts in this table have been adjusted to reflect unaudited calendar year information. 2 Gold Equivalent Ounces (“GEO”) production is estimated based using the following metal prices for each year using production units identified by Skarn Associates: $1,758/oz Au; $20.54/oz Ag; $6,185.82/lb Cu; $1,826.14/lb Pb; $2,268.85/lb Zn.
 2022 ESG Report Page 75 Page 77