
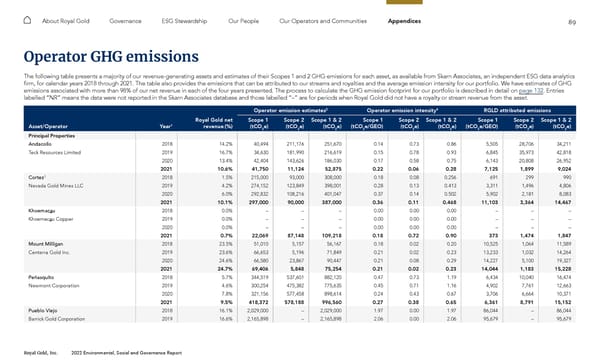
89 Royal Gold, Inc. 2022 Environmental, Social and Governance Report About Royal Gold Governance ESG Stewardship Our People Our Operators and Communities Appendices Operator GHG emissions The following table presents a majority of our revenue-generating assets and estimates of their Scopes 1 and 2 GHG emissions for each asset, as available from Skarn Associates, an independent ESG data analytics firm, for calendar years 2018 through 2021. The table also provides the emissions that can be attributed to our streams and royalties and the average emission intensity for our portfolio. We have estimates of GHG emissions associated with more than 98% of our net revenue in each of the four years presented. The process to calculate the GHG emission footprint for our portfolio is described in detail on page 132 . Entries labelled “NR” means the data were not reported in the Skarn Associates database and those labelled “–” are for periods when Royal Gold did not have a royalty or stream revenue from the asset. Operator emission estimates 2 Operator emission intensity 4 RGLD attributed emissions Asset/Operator Year 1 Royal Gold net revenue (%) Scope 1 (tCO 2 e) Scope 2 (tCO 2 e) Scope 1 & 2 (tCO 2 e) Scope 1 (tCO 2 e/GEO) Scope 2 (tCO 2 e) Scope 1 & 2 (tCO 2 e) Scope 1 (tCO 2 e/GEO) Scope 2 (tCO 2 e) Scope 1 & 2 (tCO 2 e) Principal Properties Andacollo 2018 14.2% 40,494 211,176 251,670 0.14 0.73 0.86 5,505 28,706 34,211 Teck Resources Limited 2019 16.7% 34,630 181,990 216,619 0.15 0.78 0.93 6,845 35,973 42,818 2020 13.4% 42,404 143,626 186,030 0.17 0.58 0.75 6,143 20,808 26,952 2021 10.6% 41,750 11,124 52,875 0.22 0.06 0.28 7,125 1,899 9,024 Cortez 3 2018 1.5% 215,000 93,000 308,000 0.18 0.08 0.256 691 299 990 Nevada Gold Mines LLC 2019 4.2% 274,152 123,849 398,001 0.28 0.13 0.413 3,311 1,496 4,806 2020 6.0% 292,832 108,216 401,047 0.37 0.14 0.502 5,902 2,181 8,083 2021 10.1% 297,000 90,000 387,000 0.36 0.11 0.468 11,103 3,364 14,467 Khoemac a u 2018 0.0% – – – 0.00 0.00 0.00 – – – Khoemac a u Copper 2019 0.0% – – – 0.00 0.00 0.00 – – – 2020 0.0% – – – 0.00 0.00 0.00 – – – 2021 0.7% 22,069 87,148 109,218 0.18 0.72 0.90 373 1,474 1,847 Mount Milligan 2018 23.5% 51,010 5,157 56,167 0.18 0.02 0.20 10,525 1,064 11,589 Centerra Gold Inc. 2019 23.6% 66,653 5,196 71,849 0.21 0.02 0.23 13,233 1,032 14,264 2020 24.6% 66,580 23,867 90,447 0.21 0.08 0.29 14,227 5,100 19,327 2021 24.7% 69,406 5,848 75,254 0.21 0.02 0.23 14,044 1,183 15,228 Peñasquito 2018 5.7% 344,519 537,601 882,120 0.47 0.73 1.19 6,434 10,040 16,474 Newmont Corporation 2019 4.6% 300,254 475,382 775,635 0.45 0.71 1.16 4,902 7,761 12,663 2020 7.8% 321,156 577,458 898,614 0.24 0.43 0.67 3,706 6,664 10,371 2021 9.5% 418,372 578,188 996,560 0.27 0.38 0.65 6,361 8,791 15,152 Pueblo Viejo 2018 16.1% 2,029,000 – 2,029,000 1.97 0.00 1.97 86,044 – 86,044 Barrick Gold Corporation 2019 16.6% 2,165,898 – 2,165,898 2.06 0.00 2.06 95,679 – 95,679
 2022 ESG Report Page 88 Page 90