
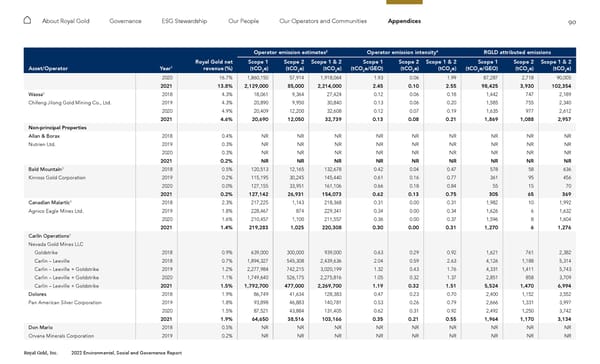
90 Royal Gold, Inc. 2022 Environmental, Social and Governance Report About Royal Gold Governance ESG Stewardship Our People Our Operators and Communities Appendices Operator emission estimates 2 Operator emission intensity 4 RGLD attributed emissions Asset/Operator Year 1 Royal Gold net revenue (%) Scope 1 (tCO 2 e) Scope 2 (tCO 2 e) Scope 1 & 2 (tCO 2 e) Scope 1 (tCO 2 e/GEO) Scope 2 (tCO 2 e) Scope 1 & 2 (tCO 2 e) Scope 1 (tCO 2 e/GEO) Scope 2 (tCO 2 e) Scope 1 & 2 (tCO 2 e) 2020 16.7% 1,860,150 57,914 1,918,064 1.93 0.06 1.99 87,287 2,718 90,005 2021 13.8% 2,129,000 85,000 2,214,000 2.45 0.10 2.55 98,425 3,930 102,354 Wassa 5 2018 4.3% 18,061 9,364 27,424 0.12 0.06 0.18 1,442 747 2,189 Chifeng Jilong Gold Mining Co., Ltd. 2019 4.3% 20,890 9,950 30,840 0.13 0.06 0.20 1,585 755 2,340 2020 4.9% 20,409 12,200 32,608 0.12 0.07 0.19 1,635 977 2,612 2021 4.6% 20,690 12,050 32,739 0.13 0.08 0.21 1,869 1,088 2,957 Non-principal Properties Allan & Borax 2018 0.4% NR NR NR NR NR NR NR NR NR Nutrien Ltd. 2019 0.3% NR NR NR NR NR NR NR NR NR 2020 0.3% NR NR NR NR NR NR NR NR NR 2021 0.2% NR NR NR NR NR NR NR NR NR Bald Mountain 3 2018 0.5% 120,513 12,165 132,678 0.42 0.04 0.47 578 58 636 Kinross Gold Corporation 2019 0.2% 115,195 30,245 145,440 0.61 0.16 0.77 361 95 456 2020 0.0% 127,155 33,951 161,106 0.66 0.18 0.84 55 15 70 2021 0.2% 127,142 26,931 154,073 0.62 0.13 0.75 305 65 369 Canadian Malartic 3 2018 2.3% 217,225 1,143 218,368 0.31 0.00 0.31 1,982 10 1,992 Agnico Eagle Mines Ltd. 2019 1.8% 228,467 874 229,341 0.34 0.00 0.34 1,626 6 1,632 2020 1.6% 210,457 1,100 211,557 0.36 0.00 0.37 1,596 8 1,604 2021 1.4% 219,283 1,025 220,308 0.30 0.00 0.31 1,270 6 1,276 Carlin Operations 3 Nevada Gold Mines LLC Goldstrike 2018 0.9% 639,000 300,000 939,000 0.63 0.29 0.92 1,621 761 2,382 Carlin – Leeville 2018 0.7% 1,894,327 545,308 2,439,636 2.04 0.59 2.63 4,126 1,188 5,314 Carlin – Leeville + Goldstrike 2019 1.2% 2,277,984 742,215 3,020,199 1.32 0.43 1.76 4,331 1,411 5,743 Carlin – Leeville + Goldstrike 2020 1.1% 1,749,640 526,175 2,275,816 1.05 0.32 1.37 2,851 858 3,709 Carlin – Leeville + Goldstrike 2021 1.5% 1,792,700 477,000 2,269,700 1.19 0.32 1.51 5,524 1,470 6,994 Dolores 2018 1.9% 86,749 41,634 128,383 0.47 0.23 0.70 2,400 1,152 3,552 Pan American Silver Corporation 2019 1.8% 93,898 46,883 140,781 0.53 0.26 0.79 2,666 1,331 3,997 2020 1.5% 87,521 43,884 131,405 0.62 0.31 0.92 2,492 1,250 3,742 2021 1.9% 64,650 38,516 103,166 0.35 0.21 0.55 1,964 1,170 3,134 Don Mario 2018 0.5% NR NR NR NR NR NR NR NR NR Orvana Minerals Corporation 2019 0.2% NR NR NR NR NR NR NR NR NR
 2022 ESG Report Page 89 Page 91