
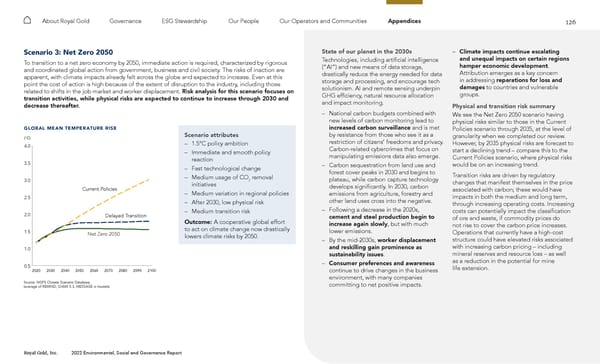
126 Royal Gold, Inc. 2022 Environmental, Social and Governance Report About Royal Gold Governance ESG Stewardship Our People Our Operators and Communities Appendices Scenario 3: Net Zero 2050 To transition to a net zero economy by 2050, immediate action is required, characterized by rigorous and coordinated global action from government, business and civil society. The risks of inaction are apparent, with climate impacts already felt across the globe and expected to increase. Even at this point the cost of action is high because of the extent of disruption to the industry, including those related to shifts in the job market and worker displacement. Risk analysis for this scenario focuses on transition activities, while physical risks are expected to continue to increase through 2030 and decrease thereafter. GLOBAL ME AN TEMPER ATURE R ISE 0.5 1.0 1.5 2.0 2.5 3.0 3.5 4.0 2020 2040 (°C) 2060 2080 2100 Net Zero 2050 Delayed Transition Current Policies Source: NGFS Climate Scenario Database, (average of REMIND, GVAM 5.3, MESSAGE ix models) Current Policies Delayed Transition Net Zero 2050 2030 2050 2070 2090 10 20 30 40 50 2020 2030 (Gt CO 2 ) 2040 2050 2060 Net Zero 2050 Delayed Transition Current Policies Source: NGFS Climate Scenario Database, (average of REMIND, GVAM 5.3, MESSAGE ix models) Current Policies Delayed Transition Net Zero 2050 Scenario attributes – 1.5°C policy ambition – Immediate and smooth policy reaction – Fast technological change – Medium usage of CO 2 removal initiatives – Medium variation in regional policies – After 2030, low physical risk – Medium transition risk Outcome: A cooperative global effort to act on climate change now drastically lowers climate risks by 2050. State of our planet in the 2030s Technologies, including artificial intelligence (“AI”) and new means of data storage, drastically reduce the energy needed for data storage and processing, and encourage tech solutionism. AI and remote sensing underpin GHG efficiency, natural resource allocation and impact monitoring. – National carbon budgets combined with new levels of carbon monitoring lead to increased carbon surveillance and is met by resistance from those who see it as a restriction of citizens’ freedoms and privacy. Carbon-related cybercrimes that focus on manipulating emissions data also emerge. – Carbon sequestration from land use and forest cover peaks in 2030 and begins to plateau, while carbon capture technology develops significantly. In 2030, carbon emissions from agriculture, forestry and other land uses cross into the negative. – Following a decrease in the 2020s, cement and steel production begin to increase again slowly , but with much lower emissions. – By the mid-2030s, worker displacement and reskilling gain prominence as sustainability issues . – Consumer preferences and awareness continue to drive changes in the business environment, with many companies committing to net positive impacts. – Climate impacts continue escalating and unequal impacts on certain regions hamper economic development . Attribution emerges as a key concern in addressing reparations for loss and damages to countries and vulnerable groups. Physical and transition risk summary We see the Net Zero 2050 scenario having physical risks similar to those in the Current Policies scenario through 2035, at the level of granularity when we completed our review. However, by 2035 physical risks are forecast to start a declining trend – compare this to the Current Policies scenario, where physical risks would be on an increasing trend. Transition risks are driven by regulatory changes that manifest themselves in the price associated with carbon; these would have impacts in both the medium and long term, through increasing operating costs. Increasing costs can potentially impact the classification of ore and waste, if commodity prices do not rise to cover the carbon price increases. Operations that currently have a high-cost structure could have elevated risks associated with increasing carbon pricing – including mineral reserves and resource loss – as well as a reduction in the potential for mine life extension.
 2022 ESG Report Page 125 Page 127