
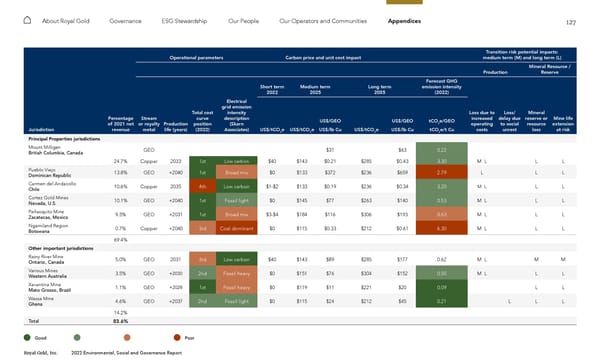
127 Royal Gold, Inc. 2022 Environmental, Social and Governance Report About Royal Gold Governance ESG Stewardship Our People Our Operators and Communities Appendices Operational parameters Carbon price and unit cost impact Transition risk potential impacts: medium term (M) and long term (L) Production Mineral Resource / Reserve Short term 2022 Medium term 2025 Long term 2035 Forecast GHG emission intensity (2022) Jurisdiction Percentage of 2021 net revenue Stream or royalty metal Production life (years) Total cost curve position (2022) Electrical grid emission intensity description (Skarn Associates) US$/tCO 2 e US$/tCO 2 e US$/GEO US$/lb Cu US$/tCO 2 e US$/GEO US$/lb Cu tCO 2 e/GEO tCO 2 e/t Cu Loss due to increased operating costs Loss/ delay due to social unrest Mineral reserve or resource loss Mine life extension at risk Principal Properties jurisdictions Mount Milligan British Columbia, Canada GEO $31 $63 0.22 24.7% Copper 2033 1st Low carbon $40 $143 $0.21 $285 $0.43 3.30 M L L L Pueblo Viejo Dominican Republic 13.8% GEO +2040 1st Broad mix $0 $133 $372 $236 $659 2.79 L L L Carmen del Andacollo Chile 10.6% Copper 2035 4th Low carbon $1-$2 $133 $0.19 $236 $0.34 3.20 M L L L Cortez Gold Mines Nevada, U.S. 10.1% GEO +2040 1st Fossil light $0 $145 $77 $263 $140 0.53 M L L L Peñasquito Mine Zacatecas, Mexico 9.5% GEO +2031 1st Broad mix $3-$4 $184 $116 $306 $193 0.63 M L L L Ngamiland Region Botswana 0.7% Copper +2040 3rd Coal dominant $0 $115 $0.33 $212 $0.61 6.30 M L L L 69.4% Other important jurisdictions Rainy River Mine Ontario, Canada 5.0% GEO 2031 3rd Low carbon $40 $143 $89 $285 $177 0.62 M L M M Various Mines Western Australia 3.5% GEO +2030 2nd Fossil heavy $0 $151 $76 $304 $152 0.50 M L L L Xavantina Mine Mato Grosso, Brazil 1.1% GEO +2028 1st Fossil heavy $0 $119 $11 $221 $20 0.09 L L Wassa Mine Ghana 4.6% GEO +2037 2nd Fossil light $0 $115 $24 $212 $45 0.21 L L L 14.2% Total 83.6% Good Poor
 2022 ESG Report Page 126 Page 128