
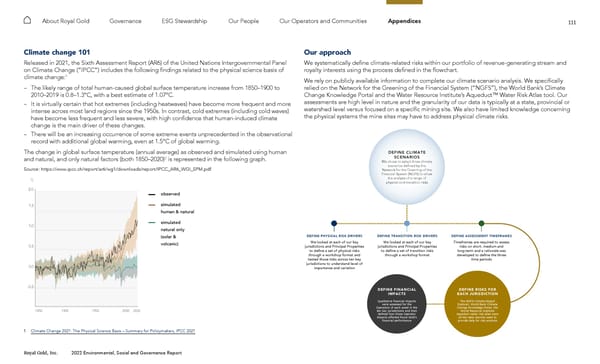
111 Royal Gold, Inc. 2022 Environmental, Social and Governance Report About Royal Gold Governance ESG Stewardship Our People Our Operators and Communities Appendices Climate change 101 Released in 2021, the Sixth Assessment Report (AR6) of the United Nations Intergovernmental Panel on Climate Change (“IPCC”) includes the following findings related to the physical science basis of climate change: 1 – The likely range of total human-caused global surface temperature increase from 1850–1900 to 2010–2019 is 0.8–1.3°C, with a best estimate of 1.07°C. – It is virtually certain that hot extremes (including heatwaves) have become more frequent and more intense across most land regions since the 1950s. In contrast, cold extremes (including cold waves) have become less frequent and less severe, with high confidence that human-induced climate change is the main driver of these changes. – There will be an increasing occurrence of some extreme events unprecedented in the observational record with additional global warming, even at 1.5°C of global warming. The change in global surface temperature (annual average) as observed and simulated using human and natural, and only natural factors (both 1850–2020) 2 is represented in the following graph. Source: https://www.ipcc.ch/report/ar6/wg1/downloads/report/IPCC_AR6_WGI_SPM.pdf 1 Climate Change 2021: The Physical Science Basis – Summary for Policymakers, IPCC 2021 Our approach We systematically define climate-related risks within our portfolio of revenue-generating stream and royalty interests using the process defined in the flowchart. We rely on publicly available information to complete our climate scenario analysis. We specifically relied on the Network for the Greening of the Financial System (“NGFS”), the World Bank’s Climate Change Knowledge Portal and the Water Resource Institute’s Aqueduct™ Water Risk Atlas tool. Our assessments are high level in nature and the granularity of our data is typically at a state, provincial or watershed level versus focused on a specific mining site. We also have limited knowledge concerning the physical systems the mine sites may have to address physical climate risks. -0.5 0.0 0.5 1.0 1.5 1850 1900 1950 2000 2020 2.0 C DEFINE TRANSITION RISK DRIVERS We looked at each of our key jurisdictions and Principal Properties to define a set of transition risks through a workshop format DEFINE ASSESSMENT TIMEFRAMES Timeframes are required to assess risks on short, medium and long-term and a rationale was developed to define the three time periods DEFINE PHYSICAL RISK DRIVERS We looked at each of our key jurisdictions and Principal Properties to define a set of physical risks through a workshop format and tested those risks across ten key jurisdictions to understand level of importance and variation DEFINE CLIMATE SCENARIOS We chose to select three climate scenarios defined by the Network for the Greening of the Financial System (NGFS) to allow the analysis of a range of physical and transition risks The NGFS Climate Impact Explorer, World Bank Climate Change Knowledge Portal, the World Resource Institute Aqueduct water risk atlas were all key data sources used to provide data for risk analysis DEFINE RISKS FOR EACH JURISDICTION Qualitative financial impacts were assessed for the Operators of each asset in the ten key jurisdictions and then defined how those Operator impacts affected Royal Gold’s financial performance DEFINE FINANCIAL IMPACTS observed simulated human & natural simulated natural only (solar & volcanic)
 2022 ESG Report Page 110 Page 112