
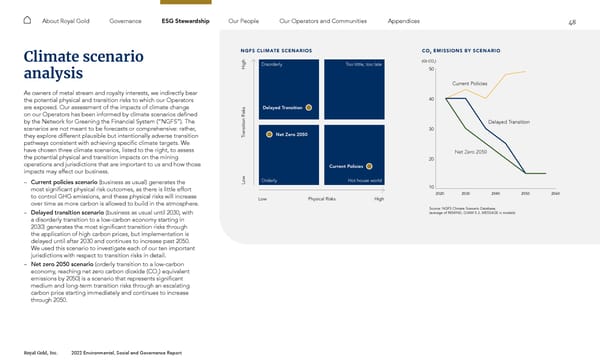
48 Royal Gold, Inc. 2022 Environmental, Social and Governance Report About Royal Gold Governance ESG Stewardship Our People Our Operators and Communities Appendices Climate scenario analysis As owners of metal stream and royalty interests, we indirectly bear the potential physical and transition risks to which our Operators are exposed. Our assessment of the impacts of climate change on our Operators has been informed by climate scenarios defined by the Network for Greening the Financial System (“NGFS”). The scenarios are not meant to be forecasts or comprehensive: rather, they explore different plausible but intentionally adverse transition pathways consistent with achieving specific climate targets. We have chosen three climate scenarios, listed to the right, to assess the potential physical and transition impacts on the mining operations and jurisdictions that are important to us and how those impacts may affect our business. – Current policies scenario (business as usual) generates the most significant physical risk outcomes, as there is little effort to control GHG emissions, and these physical risks will increase over time as more carbon is allowed to build in the atmosphere. – Delayed transition scenario (business as usual until 2030, with a disorderly transition to a low-carbon economy starting in 2030) generates the most significant transition risks through the application of high carbon prices, but implementation is delayed until after 2030 and continues to increase past 2050. We used this scenario to investigate each of our ten important jurisdictions with respect to transition risks in detail. – Net zero 2050 scenario (orderly transition to a low-carbon economy, reaching net zero carbon dioxide (CO 2 ) equivalent emissions by 2050) is a scenario that represents significant medium and long-term transition risks through an escalating carbon price starting immediately and continues to increase through 2050. NGFS CLIMATE SCENAR IOS High High Low Low Physical Risks Disorderly Orderly Too little, too late Hot house world Transition Risks Delayed Transition Net Zero 2050 Current Policies CO 2 EMISSIONS BY SCENAR IO 10 20 30 40 50 2020 2030 (Gt CO 2 ) 2040 2050 2060 Net Zero 2050 Delayed Transition Current Policies Source: NGFS Climate Scenario Database, (average of REMIND, GVAM 5.3, MESSAGE ix models) Current Policies Delayed Transition Net Zero 2050 10 20 30 40 50 2020 2030 (Gt CO 2 ) 2040 2050 2060 Net Zero 2050 Delayed Transition Current Policies Source: NGFS Climate Scenario Database, (average of REMIND, GVAM 5.3, MESSAGE ix models) Current Policies Delayed Transition Net Zero 2050
 2022 ESG Report Page 47 Page 49