
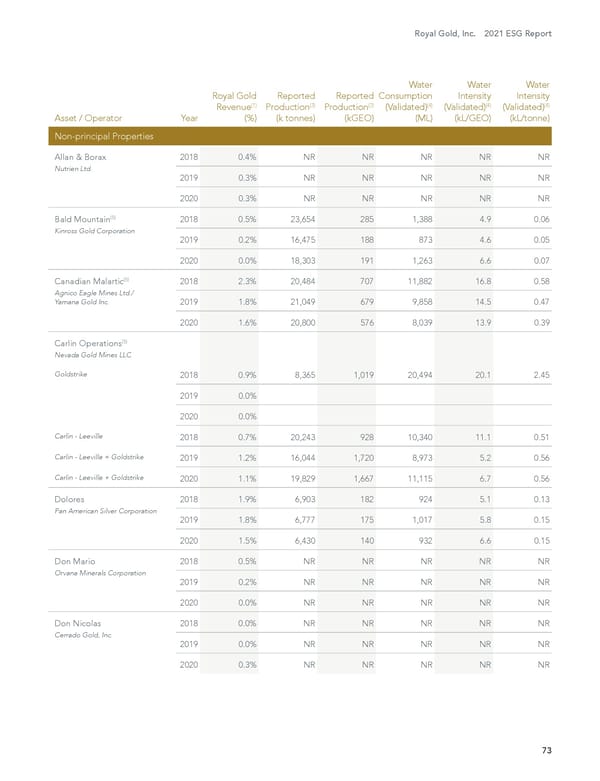
Royal Gold, Inc. 2021 ESG Report 73 Asset / Operator Year Royal Gold Revenue (1) (%) Reported Production (3) (k tonnes) Reported Production (2) (kGEO) Water Consumption (Validated) (4) (ML) Water Intensity (Validated) (4) (kL/GEO) Water Intensity (Validated) (4) (kL/tonne) Non-principal Properties Allan & Borax Nutrien Ltd. 2018 0.4% NR NR NR NR NR 2019 0.3% NR NR NR NR NR 2020 0.3% NR NR NR NR NR Bald Mountain (5) Kinross Gold Corporation 2018 0.5% 23,654 285 1,388 4.9 0.06 2019 0.2% 16,475 188 873 4.6 0.05 2020 0.0% 18,303 191 1,263 6.6 0.07 Canadian Malartic (5) Agnico Eagle Mines Ltd./ Yamana Gold Inc. 2018 2.3% 20,484 707 11,882 16.8 0.58 2019 1.8% 21,049 679 9,858 14.5 0.47 2020 1.6% 20,800 576 8,039 13.9 0.39 Carlin Operations (5) Nevada Gold Mines LLC Goldstrike 2018 0.9% 8,365 1,019 20,494 20.1 2.45 2019 0.0% 2020 0.0% Carlin - Leeville 2018 0.7% 20,243 928 10,340 11.1 0.51 Carlin - Leeville + Goldstrike 2019 1.2% 16,044 1,720 8,973 5.2 0.56 Carlin - Leeville + Goldstrike 2020 1.1% 19,829 1,667 11,115 6.7 0.56 Dolores Pan American Silver Corporation 2018 1.9% 6,903 182 924 5.1 0.13 2019 1.8% 6,777 175 1,017 5.8 0.15 2020 1.5% 6,430 140 932 6.6 0.15 Don Mario Orvana Minerals Corporation 2018 0.5% NR NR NR NR NR 2019 0.2% NR NR NR NR NR 2020 0.0% NR NR NR NR NR Don Nicolas Cerrado Gold, Inc. 2018 0.0% NR NR NR NR NR 2019 0.0% NR NR NR NR NR 2020 0.3% NR NR NR NR NR
 2021 Environment, Social and Governance Report Page 73 Page 75