
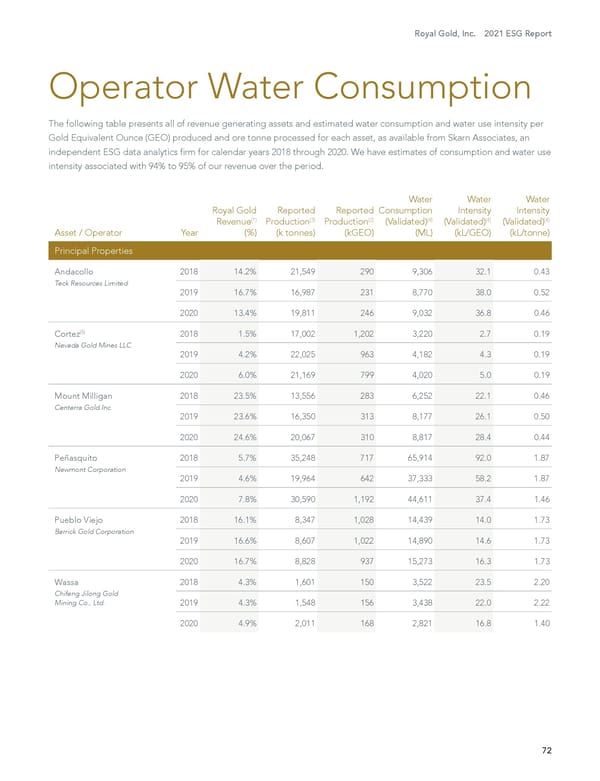
Royal Gold, Inc. 2021 ESG Report 72 Operator Water Consumption The following table presents all of revenue generating assets and estimated water consumption and water use intensity per Gold Equivalent Ounce (GEO) produced and ore tonne processed for each asset, as available from Skarn Associates, an independent ESG data analytics firm for calendar years 2018 through 2020. We have estimates of consumption and water use intensity associated with 94% to 95% of our revenue over the period. Asset / Operator Year Royal Gold Revenue (1) (%) Reported Production (3) (k tonnes) Reported Production (2) (kGEO) Water Consumption (Validated) (4) (ML) Water Intensity (Validated) (4) (kL/GEO) Water Intensity (Validated) (4) (kL/tonne) Principal Properties Andacollo Teck Resources Limited 2018 14.2% 21,549 290 9,306 32.1 0.43 2019 16.7% 16,987 231 8,770 38.0 0.52 2020 13.4% 19,811 246 9,032 36.8 0.46 Cortez (5) Nevada Gold Mines LLC 2018 1.5% 17,002 1,202 3,220 2.7 0.19 2019 4.2% 22,025 963 4,182 4.3 0.19 2020 6.0% 21,169 799 4,020 5.0 0.19 Mount Milligan Centerra Gold Inc. 2018 23.5% 13,556 283 6,252 22.1 0.46 2019 23.6% 16,350 313 8,177 26.1 0.50 2020 24.6% 20,067 310 8,817 28.4 0.44 Peñasquito Newmont Corporation 2018 5.7% 35,248 717 65,914 92.0 1.87 2019 4.6% 19,964 642 37,333 58.2 1.87 2020 7.8% 30,590 1,192 44,611 37.4 1.46 Pueblo Viejo Barrick Gold Corporation 2018 16.1% 8,347 1,028 14,439 14.0 1.73 2019 16.6% 8,607 1,022 14,890 14.6 1.73 2020 16.7% 8,828 937 15,273 16.3 1.73 Wassa Chifeng Jilong Gold Mining Co., Ltd. 2018 4.3% 1,601 150 3,522 23.5 2.20 2019 4.3% 1,548 156 3,438 22.0 2.22 2020 4.9% 2,011 168 2,821 16.8 1.40
 2021 Environment, Social and Governance Report Page 72 Page 74