
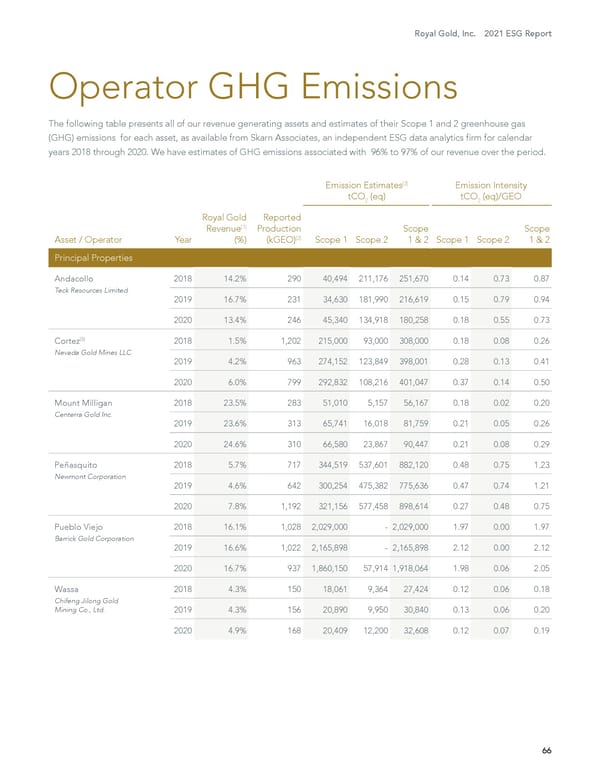
Royal Gold, Inc. 2021 ESG Report 66 Operator GHG Emissions The following table presents all of our revenue generating assets and estimates of their Scope 1 and 2 greenhouse gas (GHG) emissions for each asset, as available from Skarn Associates, an independent ESG data analytics firm for calendar years 2018 through 2020. We have estimates of GHG emissions associated with 96% to 97% of our revenue over the period. Emission Estimates (3) tCO 2 (eq) Emission Intensity tCO 2 (eq)/GEO Asset / Operator Year Royal Gold Revenue (1) (%) Reported Production (kGEO) (2) Scope 1 Scope 2 Scope 1 & 2 Scope 1 Scope 2 Scope 1 & 2 Principal Properties Andacollo Teck Resources Limited 2018 14.2% 290 40,494 211,176 251,670 0.14 0.73 0.87 2019 16.7% 231 34,630 181,990 216,619 0.15 0.79 0.94 2020 13.4% 246 45,340 134,918 180,258 0.18 0.55 0.73 Cortez (5) Nevada Gold Mines LLC 2018 1.5% 1,202 215,000 93,000 308,000 0.18 0.08 0.26 2019 4.2% 963 274,152 123,849 398,001 0.28 0.13 0.41 2020 6.0% 799 292,832 108,216 401,047 0.37 0.14 0.50 Mount Milligan Centerra Gold Inc. 2018 23.5% 283 51,010 5,157 56,167 0.18 0.02 0.20 2019 23.6% 313 65,741 16,018 81,759 0.21 0.05 0.26 2020 24.6% 310 66,580 23,867 90,447 0.21 0.08 0.29 Peñasquito Newmont Corporation 2018 5.7% 717 344,519 537,601 882,120 0.48 0.75 1.23 2019 4.6% 642 300,254 475,382 775,636 0.47 0.74 1.21 2020 7.8% 1,192 321,156 577,458 898,614 0.27 0.48 0.75 Pueblo Viejo Barrick Gold Corporation 2018 16.1% 1,028 2,029,000 - 2,029,000 1.97 0.00 1.97 2019 16.6% 1,022 2,165,898 - 2,165,898 2.12 0.00 2.12 2020 16.7% 937 1,860,150 57,914 1,918,064 1.98 0.06 2.05 Wassa Chifeng Jilong Gold Mining Co., Ltd. 2018 4.3% 150 18,061 9,364 27,424 0.12 0.06 0.18 2019 4.3% 156 20,890 9,950 30,840 0.13 0.06 0.20 2020 4.9% 168 20,409 12,200 32,608 0.12 0.07 0.19
 2021 Environment, Social and Governance Report Page 66 Page 68