
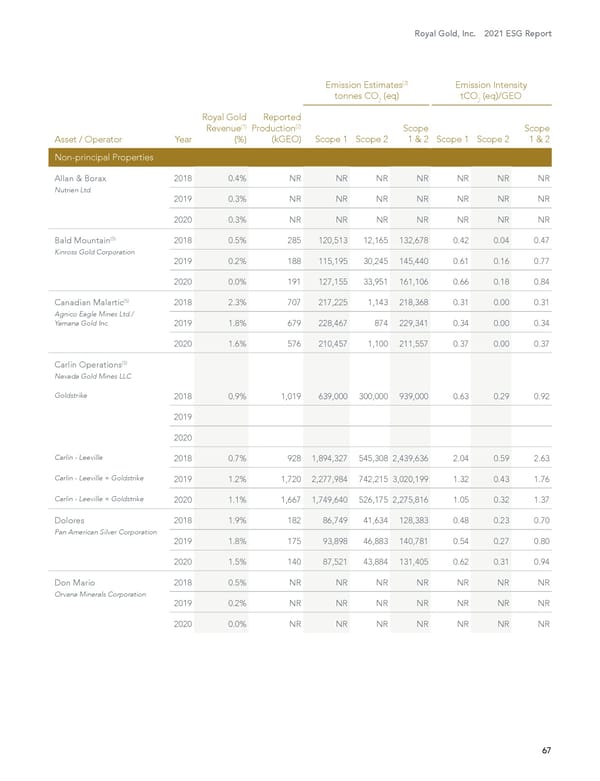
Royal Gold, Inc. 2021 ESG Report 67 Emission Estimates (3) tonnes CO 2 (eq) Emission Intensity tCO 2 (eq)/GEO Asset / Operator Year Royal Gold Revenue (1) (%) Reported Production (2) (kGEO) Scope 1 Scope 2 Scope 1 & 2 Scope 1 Scope 2 Scope 1 & 2 Non-principal Properties Allan & Borax Nutrien Ltd. 2018 0.4% NR NR NR NR NR NR NR 2019 0.3% NR NR NR NR NR NR NR 2020 0.3% NR NR NR NR NR NR NR Bald Mountain (5) Kinross Gold Corporation 2018 0.5% 285 120,513 12,165 132,678 0.42 0.04 0.47 2019 0.2% 188 115,195 30,245 145,440 0.61 0.16 0.77 2020 0.0% 191 127,155 33,951 161,106 0.66 0.18 0.84 Canadian Malartic (5) Agnico Eagle Mines Ltd./ Yamana Gold Inc. 2018 2.3% 707 217,225 1,143 218,368 0.31 0.00 0.31 2019 1.8% 679 228,467 874 229,341 0.34 0.00 0.34 2020 1.6% 576 210,457 1,100 211,557 0.37 0.00 0.37 Carlin Operations (5) Nevada Gold Mines LLC Goldstrike 2018 0.9% 1,019 639,000 300,000 939,000 0.63 0.29 0.92 2019 2020 Carlin - Leeville 2018 0.7% 928 1,894,327 545,308 2,439,636 2.04 0.59 2.63 Carlin - Leeville + Goldstrike 2019 1.2% 1,720 2,277,984 742,215 3,020,199 1.32 0.43 1.76 Carlin - Leeville + Goldstrike 2020 1.1% 1,667 1,749,640 526,175 2,275,816 1.05 0.32 1.37 Dolores Pan American Silver Corporation 2018 1.9% 182 86,749 41,634 128,383 0.48 0.23 0.70 2019 1.8% 175 93,898 46,883 140,781 0.54 0.27 0.80 2020 1.5% 140 87,521 43,884 131,405 0.62 0.31 0.94 Don Mario Orvana Minerals Corporation 2018 0.5% NR NR NR NR NR NR NR 2019 0.2% NR NR NR NR NR NR NR 2020 0.0% NR NR NR NR NR NR NR
 2021 Environment, Social and Governance Report Page 67 Page 69