
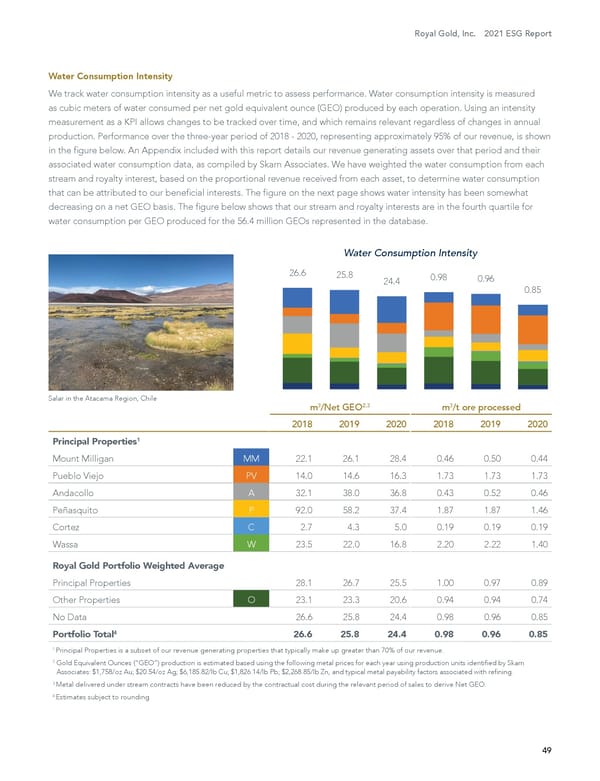
Royal Gold, Inc. 2021 ESG Report 49 Water Consumption Intensity We track water consumption intensity as a useful metric to assess performance. Water consumption intensity is measured as cubic meters of water consumed per net gold equivalent ounce (GEO) produced by each operation. Using an intensity measurement as a KPI allows changes to be tracked over time, and which remains relevant regardless of changes in annual production. Performance over the three-year period of 2018 - 2020, representing approximately 95% of our revenue, is shown in the figure below. An Appendix included with this report details our revenue generating assets over that period and their associated water consumption data, as compiled by Skarn Associates. We have weighted the water consumption from each stream and royalty interest, based on the proportional revenue received from each asset, to determine water consumption that can be attributed to our beneficial interests. The figure on the next page shows water intensity has been somewhat decreasing on a net GEO basis. The figure below shows that our stream and royalty interests are in the fourth quartile for water consumption per GEO produced for the 56.4 million GEOs represented in the database. Water Consumption Intensity 26.6 25.8 24.4 0.98 0.96 0.85 m 3 /Net GEO 2,3 m 3 /t ore processed 2018 2019 2020 2018 2019 2020 Principal Properties 1 Mount Milligan MM 22.1 26.1 28.4 0.46 0.50 0.44 Pueblo Viejo PV 14.0 14.6 16.3 1.73 1.73 1.73 Andacollo A 32.1 38.0 36.8 0.43 0.52 0.46 Peñasquito P 92.0 58.2 37.4 1.87 1.87 1.46 Cortez C 2.7 4.3 5.0 0.19 0.19 0.19 Wassa W 23.5 22.0 16.8 2.20 2.22 1.40 Royal Gold Portfolio Weighted Average Principal Properties 28.1 26.7 25.5 1.00 0.97 0.89 Other Properties O 23.1 23.3 20.6 0.94 0.94 0.74 No Data ND 26.6 25.8 24.4 0.98 0.96 0.85 Portfolio Total 4 26.6 25.8 24.4 0.98 0.96 0.85 1 Principal Properties is a subset of our revenue generating properties that typically make up greater than 70% of our revenue. 2 Gold Equivalent Ounces (“GEO”) production is estimated based using the following metal prices for each year using production units identified by Skarn Associates: $1,758/oz Au; $20.54/oz Ag; $6,185.82/lb Cu; $1,826.14/lb Pb; $2,268.85/lb Zn, and typical metal payability factors associated with refining. 3 Metal delivered under stream contracts have been reduced by the contractual cost during the relevant period of sales to derive Net GEO. 4 Estimates subject to rounding Salar in the Atacama Region, Chile
 2021 Environment, Social and Governance Report Page 49 Page 51