
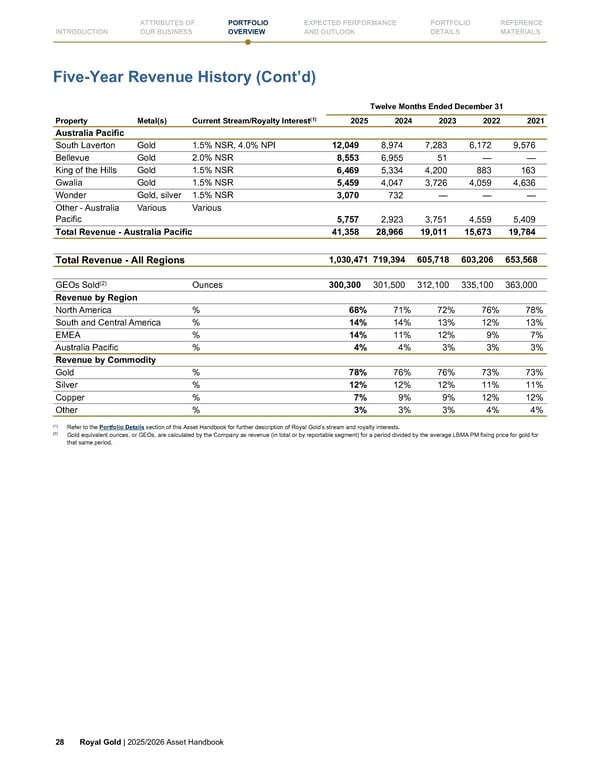
Five-Year Revenue History (Cont’d) Twelve Months Ended December 31 Property Metal(s) Current Stream/Royalty Interest(1) 2025 2024 2023 2022 2021 Australia Pacific South Laverton Gold 1.5% NSR, 4.0% NPI 12,049 8,974 7,283 6,172 9,576 Bellevue Gold 2.0% NSR 8,553 6,955 51 — — King of the Hills Gold 1.5% NSR 6,469 5,334 4,200 883 163 Gwalia Gold 1.5% NSR 5,459 4,047 3,726 4,059 4,636 Wonder Gold, silver 1.5% NSR 3,070 732 — — — Other - Australia Pacific Various Various 5,757 2,923 3,751 4,559 5,409 Total Revenue - Australia Pacific 41,358 28,966 19,011 15,673 19,784 Total Revenue - All Regions 1,030,471 719,394 605,718 603,206 653,568 GEOs Sold(2) Ounces 300,300 301,500 312,100 335,100 363,000 Revenue by Region North America % 68% 71% 72% 76% 78% South and Central America % 14% 14% 13% 12% 13% EMEA % 14% 11% 12% 9% 7% Australia Pacific % 4% 4% 3% 3% 3% Revenue by Commodity Gold % 78% 76% 76% 73% 73% Silver % 12% 12% 12% 11% 11% Copper % 7% 9% 9% 12% 12% Other % 3% 3% 3% 4% 4% (1) Refer to the Portfolio Details section of this Asset Handbook for further description of Royal Gold’s stream and royalty interests. (2) Gold equivalent ounces, or GEOs, are calculated by the Company as revenue (in total or by reportable segment) for a period divided by the average LBMA PM fixing price for gold for that same period. 28 Royal Gold | 2025/2026 Asset Handbook INTRODUCTION ATTRIBUTES OF OUR BUSINESS PORTFOLIO OVERVIEW EXPECTED PERFORMANCE AND OUTLOOK PORTFOLIO DETAILS REFERENCE MATERIALS
 Royal Gold, Inc. 2025/2026 Asset Handbook Page 27 Page 29