
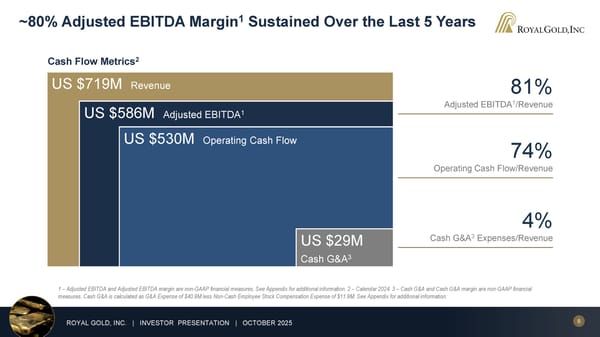
8 ROYAL GOLD, INC. | INVESTOR PRESENTATION | OCTOBER 2025 1 – Adjusted EBITDA and Adjusted EBITDA margin are non-GAAP financial measures. See Appendix for additional information. 2 – Calendar 2024. 3 – Cash G&A and Cash G&A margin are non-GAAP financial measures. Cash G&A is calculated as G&A Expense of $40.9M less Non-Cash Employee Stock Compensation Expense of $11.9M. See Appendix for additional information. US $719M Revenue US $586M Adjusted EBITDA 1 US $530M Operating Cash Flow US $29M Cash G&A 3 Cash Flow Metrics 2 81% Adjusted EBITDA 1 /Revenue 74% Operating Cash Flow/Revenue 4% Cash G&A 3 Expenses/Revenue ~80% Adjusted EBITDA Margin 1 Sustained Over the Last 5 Years
 October 2025 Investor Presentation Page 7 Page 9