
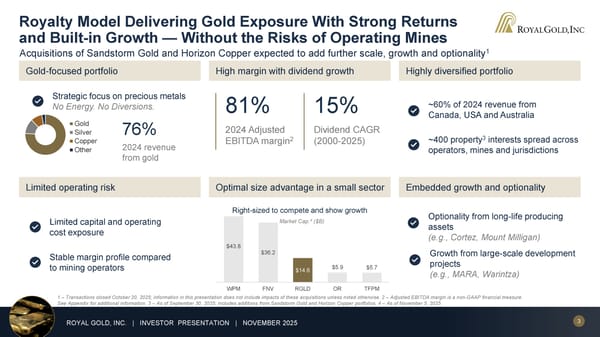
3 ROYAL GOLD, INC. | INVESTOR PRESENTATION | NOVEMBER 2025 81% 2024 Adjusted EBITDA margin 2 ~60% of 2024 revenue from Canada, USA and Australia ~400 property 3 interests spread across operators, mines and jurisdictions Optionality from long-life producing assets (e.g., Cortez, Mount Milligan) High margin with dividend growth Highly diversified portfolio Optimal size advantage in a small sector Embedded growth and optionality Gold-focused portfolio Limited capital and operating cost exposure Stable margin profile compared to mining operators Limited operating risk Gold Silver Copper Other Strategic focus on precious metals No Energy. No Diversions. 2024 revenue from gold 15% Dividend CAGR (2000-2025) $43.8 $36.2 $14.6 $5.9 $5.7 WPM FNV RGLD OR TFPM Right-sized to compete and show growth Market Cap. 4 ($B) 76% 1 – Transactions closed October 20, 2025; information in this presentation does not include impacts of these acquisitions unless noted otherwise. 2 – Adjusted EBITDA margin is a non-GAAP financial measure. See Appendix for additional information. 3 – As of September 30, 2025; includes additions from Sandstorm Gold and Horizon Copper portfolios. 4 – As of November 5, 2025. Royalty Model Delivering Gold Exposure With Strong Returns and Built-in Growth — Without the Risks of Operating Mines Acquisitions of Sandstorm Gold and Horizon Copper expected to add further scale, growth and optionality 1 Growth from large-scale development projects (e.g., MARA, Warintza)
 November 2025 Investor Presentation Page 2 Page 4