
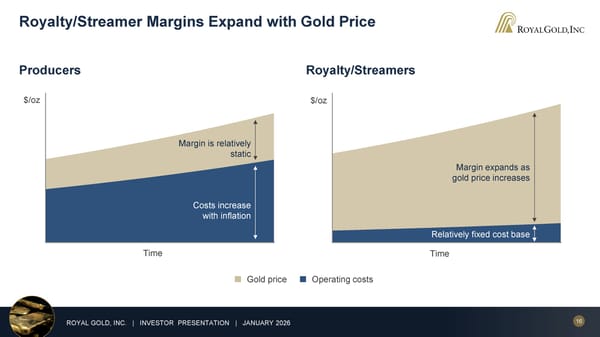
16 ROYAL GOLD, INC. | INVESTOR PRESENTATION | JANUARY 2026 0 500 1000 1500 2000 2500 3000 3500 4000 4500 5000 1 2 3 4 5 6 7 8 9 10 $/oz Time 0 500 1000 1500 2000 2500 3000 3500 1 2 3 4 5 6 7 8 9 10 $/oz Time Royalty/Streamer Margins Expand with Gold Price Producers Royalty/Streamers Gold price Operating costs Margin expands as gold price increases Margin is relatively static Relatively fixed cost base Costs increase with inflation
 January 2026 Investor Presentation Page 15 Page 17