
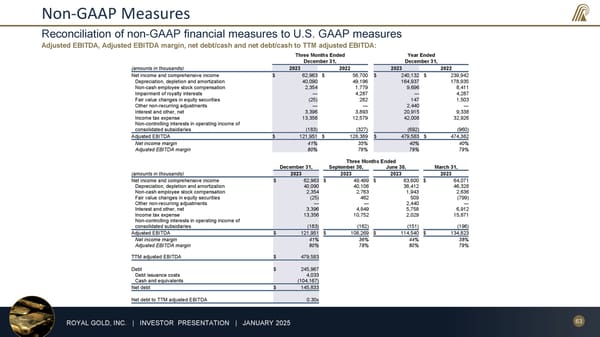
63 ROYAL GOLD, INC. | INVESTOR PRESENTATION | JANUARY 2025 Non-GAAP Measures Adjusted EBITDA, Adjusted EBITDA margin, net debt/cash and net debt/cash to TTM adjusted EBITDA: Reconciliation of non-GAAP financial measures to U.S. GAAP measures Three Months Ended Year Ended December 31, December 31, (amounts in thousands) 2023 2022 2023 2022 Net income and comprehensive income $ 62,963 $ 56,700 $ 240,132 $ 239,942 Depreciation, depletion and amortization 40,090 49,196 164,937 178,935 Non-cash employee stock compensation 2,354 1,779 9,696 8,411 Impairment of royalty interests — 4,287 — 4,287 Fair value changes in equity securities (25) 282 147 1,503 Other non-recurring adjustments — — 2,440 — Interest and other, net 3,396 3,893 20,915 9,338 Income tax expense 13,356 12,579 42,008 32,926 Non-controlling interests in operating income of consolidated subsidiaries (183) (327) (692) (960) Adjusted EBITDA $ 121,951 $ 128,389 $ 479,583 $ 474,382 Net income margin 41% 35% 40% 40% Adjusted EBITDA margin 80% 79% 79% 79% Three Months Ended December 31, September 30, June 30, March 31, (amounts in thousands) 2023 2023 2023 2023 Net income and comprehensive income $ 62,963 $ 49,499 $ 63,600 $ 64,071 Depreciation, depletion and amortization 40,090 40,106 38,412 46,328 Non-cash employee stock compensation 2,354 2,763 1,943 2,636 Fair value changes in equity securities (25) 462 509 (799) Other non-recurring adjustments — — 2,440 — Interest and other, net 3,396 4,849 5,758 6,912 Income tax expense 13,356 10,752 2,029 15,871 Non-controlling interests in operating income of consolidated subsidiaries (183) (162) (151) (196) Adjusted EBITDA $ 121,951 $ 108,269 $ 114,540 $ 134,823 Net income margin 41% 36% 44% 38% Adjusted EBITDA margin 80% 78% 80% 79% TTM adjusted EBITDA $ 479,583 Debt $ 245,967 Debt issuance costs 4,033 Cash and equivalents (104,167) Net debt $ 145,833 Net debt to TTM adjusted EBITDA 0.30x
 January 2025 Investor Presentation Page 62 Page 64