
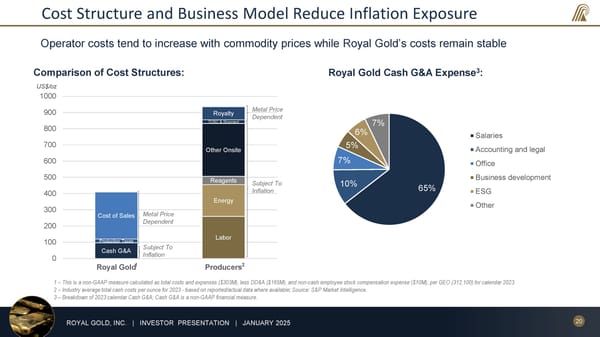
20 ROYAL GOLD, INC. | INVESTOR PRESENTATION | JANUARY 2025 Cost Structure and Business Model Reduce Inflation Exposure Operator costs tend to increase with commodity prices while Royal Gold’s costs remain stable 1 – This is a non-GAAP measure calculated as total costs and expenses ($303M), less DD&A ($165M), and non-cash employee stock compensation expense ($10M), per GEO (312,100) for calendar 2023. 2 – Industry average total cash costs per ounce for 2023 - based on reported/actual data where available; Source: S&P Market Intelligence. 3 – Breakdown of 2023 calendar Cash G&A; Cash G&A is a non-GAAP financial measure. Cash G&A Production Taxes Cost of Sales Labor Energy Reagents Other Onsite TCRC & Shipment Royalty 0 100 200 300 400 500 600 700 800 900 1000 Royal Gold Producers Comparison of Cost Structures: Metal Price Dependent Subject To Inflation 2 Metal Price Dependent Subject To Inflation US$/oz 1 65% 10% 7% 5% 6% 7% Salaries Accounting and legal Office Business development ESG Other Royal Gold Cash G&A Expense 3 :
 January 2025 Investor Presentation Page 19 Page 21