
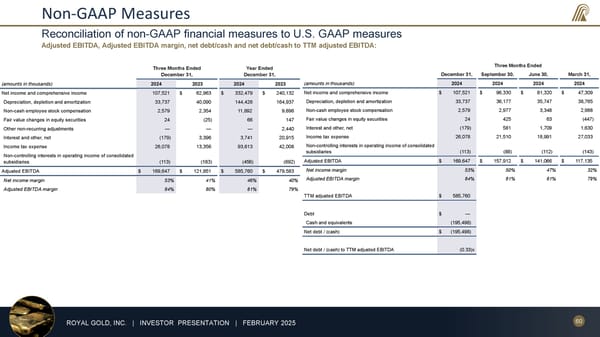
60 ROYAL GOLD, INC. | INVESTOR PRESENTATION | FEBRUARY 2025 Non-GAAP Measures Adjusted EBITDA, Adjusted EBITDA margin, net debt/cash and net debt/cash to TTM adjusted EBITDA: Reconciliation of non-GAAP financial measures to U.S. GAAP measures Three Months Ended December 31, Year Ended December 31, (amounts in thousands) 2024 2023 2024 2023 Net income and comprehensive income 107,521 $ 62,963 $ 332,479 $ 240,132 Depreciation, depletion and amortization 33,737 40,090 144,426 164,937 Non-cash employee stock compensation 2,579 2,354 11,892 9,696 Fair value changes in equity securities 24 (25) 66 147 Other non-recurring adjustments — — — 2,440 Interest and other, net (179) 3,396 3,741 20,915 Income tax expense 26,078 13,356 93,613 42,008 Non-controlling interests in operating income of consolidated subsidiaries (113) (183) (456) (692) Adjusted EBITDA $ 169,647 $ 121,951 $ 585,760 $ 479,583 Net income margin 53% 41% 46% 40% Adjusted EBITDA margin 84% 80% 81% 79% Three Months Ended December 31, September 30, June 30, March 31, (amounts in thousands) 2024 2024 2024 2024 Net income and comprehensive income $ 107,521 $ 96,330 $ 81,320 $ 47,309 Depreciation, depletion and amortization 33,737 36,177 35,747 38,765 Non-cash employee stock compensation 2,579 2,977 3,348 2,988 Fair value changes in equity securities 24 425 63 (447) Interest and other, net (179) 581 1,709 1,630 Income tax expense 26,078 21,510 18,991 27,033 Non-controlling interests in operating income of consolidated subsidiaries (113) (88) (112) (143) Adjusted EBITDA $ 169,647 $ 157,912 $ 141,066 $ 117,135 Net income margin 53% 50% 47% 32% Adjusted EBITDA margin 84% 81% 81% 79% TTM adjusted EBITDA $ 585,760 Debt $ — Cash and equivalents (195,498) Net debt / (cash) $ (195,498) Net debt / (cash) to TTM adjusted EBITDA (0.33)x
 February 2025 Investor Presentation Page 59 Page 61