
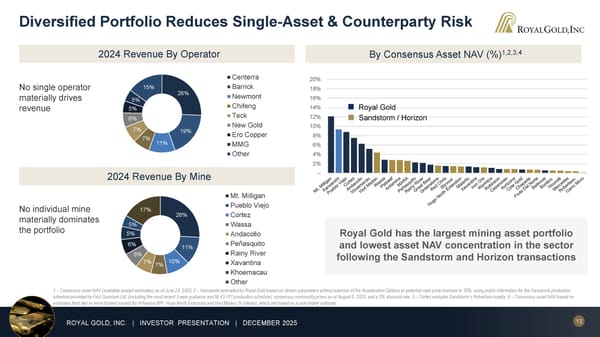
13 ROYAL GOLD, INC. | INVESTOR PRESENTATION | DECEMBER 2025 2024 Revenue By Operator 2024 Revenue By Mine 26% 19% 11% 7% 7% 6% 5% 5% 15% Centerra Barrick Newmont Chifeng Teck New Gold Ero Copper MMG Other No single operator materially drives revenue 26% 11% 10% 7% 7% 6% 6% 5% 5% 17% Mt. Milligan Pueblo Viejo Cortez Wassa Andacollo Peñasquito Rainy River Xavantina Khoemacau Other No individual mine materially dominates the portfolio By Consensus Asset NAV (%) 1,2,3,4 Diversified Portfolio Reduces Single-Asset & Counterparty Risk -- 2% 4% 6% 8% 10% 12% 14% 16% 18% 20% Royal Gold Sandstorm / Horizon Royal Gold has the largest mining asset portfolio and lowest asset NAV concentration in the sector following the Sandstorm and Horizon transactions 1 – Consensus asset NAV (available analyst estimates) as of June 25, 2025. 2 – Kansanshi estimated by Royal Gold based on stream parameters without exercise of the Acceleration Options or potential cash price increase to 35%, using public information for the Kansanshi production schedule provided by First Quantum Ltd. (including the most recent 3-year guidance and NI 43-101 production schedule), consensus commodity prices as of August 5, 2025, and a 5% discount rate. 3 – Cortez excludes Sandstorm’s Robertson royalty. 4 -- Consensus asset NAV based on estimates from two or more brokers except for Antamina NPI, Hugo North Extension and Hod Maden JV interest, which are based on a sole broker estimate.
 December 2025 Investor Presentation Page 12 Page 14