
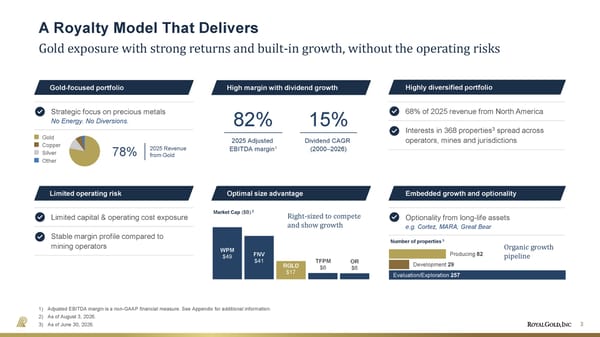
Strategic focus on precious metals No Energy. No Diversions. Limited capital & operating cost exposure Stable margin profile compared to mining operators Producing 82 Development 29 Evaluation/Exploration 257 Number of properties 3 WPM $49 FNV $41 RGLD $17 TFPM $6 OR $6 Market Cap ($B) 2 A Royalty Model That Delivers Gold exposure with strong returns and built-in growth, without the operating risks 1) Adjusted EBITDA margin is a non-GAAP financial measure. See Appendix for additional information. 2) As of August 3, 2026. 3) As of June 30, 2026. Gold-focused portfolio High margin with dividend growth Highly diversified portfolio Embedded growth and optionality Limited operating risk Optimal size advantage 82% 2025 Adjusted EBITDA margin 1 15% Dividend CAGR (2000–2026) 68% of 2025 revenue from North America Interests in 368 properties 3 spread across operators, mines and jurisdictions Other Copper Silver Gold Optionality from long-life assets e.g. Cortez, MARA, Great Bear Right-sized to compete and show growth Organic growth pipeline 78% 2025 Revenue from Gold 3
 August 2026 Investor Presentation Page 2 Page 4