
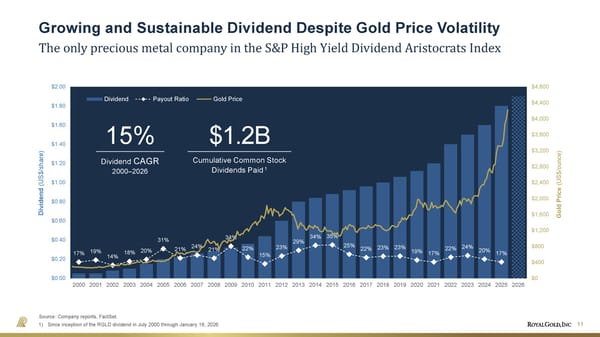
17% 19% 14% 18% 20% 31% 21% 24% 21% 34% 22% 15% 23% 29% 34% 35% 25% 22% 23% 23% 19% 17% 22% 24% 20% 17% $0 $400 $800 $1,200 $1,600 $2,000 $2,400 $2,800 $3,200 $3,600 $4,000 $4,400 $4,800 $0.00 $0.20 $0.40 $0.60 $0.80 $1.00 $1.20 $1.40 $1.60 $1.80 $2.00 2000 2001 2002 2003 2004 2005 2006 2007 2008 2009 2010 2011 2012 2013 2014 2015 2016 2017 2018 2019 2020 2021 2022 2023 2024 2025 2026 Gold Price (US$/ounce) Dividend (US$/share) Dividend Payout Ratio Gold Price $0 $400 $800 $1,200 $1,600 $2,000 $2,400 $2,800 $3,200 $3,600 $4,000 $4,400 $4,800 $0.00 $0.20 $0.40 $0.60 $0.80 $1.00 $1.20 $1.40 $1.60 $1.80 $2.00 Gold Price (US$/ounce) Dividend (US$/share) 11 Growing and Sustainable Dividend Despite Gold Price Volatility The only precious metal company in the S&P High Yield Dividend Aristocrats Index Source: Company reports, FactSet. 1) Since inception of the RGLD dividend in July 2000 through January 16, 2026. 15% Dividend CAGR 2000–2026 $1.2B Cumulative Common Stock Dividends Paid 1
 April 2026 Investor Presentation Page 10 Page 12