
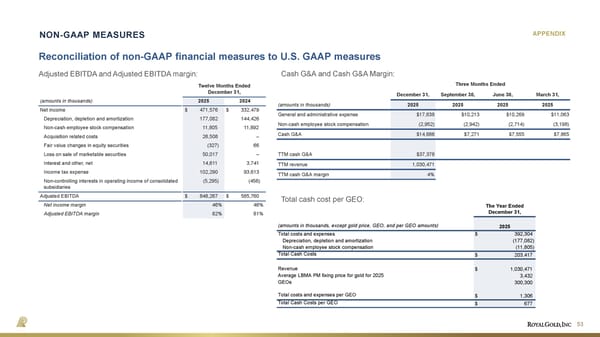
APPENDIX Reconciliation of non-GAAP financial measures to U.S. GAAP measures 53 Adjusted EBITDA and Adjusted EBITDA margin: NON-GAAP MEASURES (amounts in thousands) Net income Depreciation, depletion and amortization Non - cash employee stock compensation Acquisition related costs Fair value changes in equity securities Loss on sale of marketable securities Interest and other, net Income tax expense Non - controlling interests in operating income of consolidated subsidiaries Adjusted EBITDA Net income margin Adjusted EBITDA margin Twelve Months Ended December 31, 2025 2024 $ 471,576 $ 332,479 177,082 144,426 11,805 11,892 26,508 – (327) 66 50,017 – 14,611 3,741 102,290 93,613 (5,295) (456) $ 848,267 $ 585,760 46% 46% 82% 81% December 31, September 30, June 30, March 31, (amounts in thousands) 2025 2025 2025 2025 General and administrative expense $17,638 $10,213 $10,269 $11,063 Non-cash employee stock compensation (2,952) (2,942) (2,714) (3,198) Cash G&A $14,686 $7,271 $7,555 $7,865 TTM cash G&A $37,378 TTM revenue 1,030,471 TTM cash G&A margin 4% Three Months Ended (amounts in thousands, except gold price, GEO, and per GEO amounts) Total costs and expenses $ 392,304 Depreciation, depletion and amortization (177,082) Non-cash employee stock compensation (11,805) Total Cash Costs $ 203,417 Revenue $ 1,030,471 Average LBMA PM fixing price for gold for 2025 3,432 GEOs 300,300 Total costs and expenses per GEO $ 1,306 Total Cash Costs per GEO $ 677 2025 The Year Ended December 31, Cash G&A and Cash G&A Margin: Total cash cost per GEO:
 April 2026 Investor Presentation Page 52 Page 54