
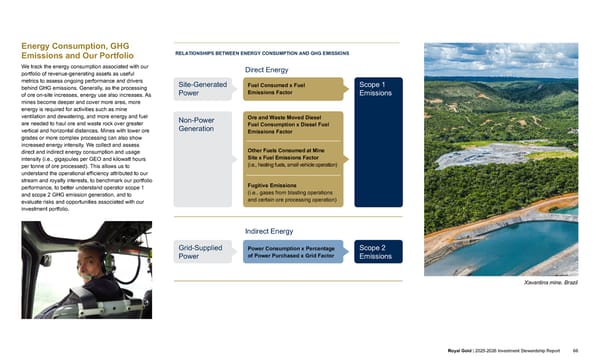
Energy Consumption, GHG Emissions and Our Portfolio We track the energy consumption associated with our portfolio of revenue-generating assets as useful metrics to assess ongoing performance and drivers behind GHG emissions. Generally, as the processing of ore on-site increases, energy use also increases. As mines become deeper and cover more area, more energy is required for activities such as mine ventilation and dewatering, and more energy and fuel are needed to haul ore and waste rock over greater vertical and horizontal distances. Mines with lower ore grades or more complex processing can also show increased energy intensity. We collect and assess direct and indirect energy consumption and usage intensity (i.e., gigajoules per GEO and kilowatt hours per tonne of ore processed). This allows us to understand the operational efficiency attributed to our stream and royalty interests, to benchmark our portfolio performance, to better understand operator scope 1 and scope 2 GHG emission generation, and to evaluate risks and opportunities associated with our investment portfolio. RELATIONSHIPS BETWEEN ENERGY CONSUMPTION AND GHG EMISSIONS Direct Energy Site-Generated Power Fuel Consumed x Fuel Emissions Factor Scope 1 Emissions Non-Power Generation Ore and Waste Moved Diesel Fuel Consumption x Diesel Fuel Emissions Factor Other Fuels Consumed at Mine Site x Fuel Emissions Factor (i.e., heating fuels, small vehicle operation) Fugitive Emissions (i.e., gases from blasting operations and certain ore processing operation) Indirect Energy Grid-Supplied Power Power Consumption x Percentage of Power Purchased x Grid Factor Scope 2 Emissions INTRODUCTION ABOUT ROYAL GOLD GOVERNANCE OUR PEOPLE OPERATORS AND COMMUNITIES INVESTMENT STEWARDSHIP APPENDICES Royal Gold | 2025-2026 Investment Stewardship Report 66 Xavantina mine, Brazil
 2025–2026 Investment Stewardship Report Page 65 Page 67