
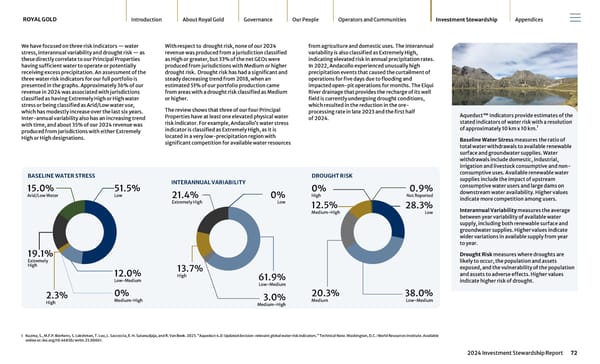
We have focused on three risk indicators — water stress, interannual variability and drought risk — as these directly correlate to our Principal Properties having sufficient water to operate or potentially receiving excess precipitation. An assessment of the three water risk indicators for our full portfolio is presented in the graphs. Approximately 36% of our revenue in 2024 was associated with jurisdictions classified as having Extremely High or High water stress or being classified as Arid/Low water use, which has modestly increase over the last six years. Inter-annual variability also has an increasing trend with time, and about 35% of our 2024 revenue was produced from jurisdictions with either Extremely High or High designations. With respect to drought risk, none of our 2024 revenue was produced from a jurisdiction classified as High or greater, but 33% of the net GEOs were produced from jurisdictions with Medium or higher drought risk. Drought risk has had a significant and steady decreasing trend from 2018, when an estimated 51% of our portfolio production came from areas with a drought risk classified as Medium or higher. The review shows that three of our four Principal Properties have at least one elevated physical water risk indicator. For example, Andacollo’s water stress indicator is classified as Extremely High, as it is located in a very low-precipitation region with significant competition for available water resources from agriculture and domestic uses. The interannual variability is also classified as Extremely High, indicating elevated risk in annual precipitation rates. In 2022, Andacollo experienced unusually high precipitation events that caused the curtailment of operations for five days due to flooding and impacted open-pit operations for months. The Elqui River drainage that provides the recharge of its well field is currently undergoing drought conditions, which resulted in the reduction in the ore- processing rate in late 2023 and the first half of 2024. ROYAL GOLD Introduction About Royal Gold Governance Our People Operators and Communities Investment Stewardship Appendices 2024 Investment Stewardship Report 72 BASELINE WATER STRESS 15.0% Arid/Low Water 19.1% Extremely High 2.3% High 51.5% Low 12.0% Low-Medium 0% Medium-High INTERANNUAL VARIABILITY 21.4% Extremely High 0% Low 13.7% High 61.9% Low-Medium 3.0% Medium-High DROUGHT RISK 0% High 12.5% Medium-High 20.3% Medium 0.9% Not Reported 28.3% Low 38.0% Low-Medium Aqueduct™ Indicators provide estimates of the stated indicators of water risk with a resolution of approximately 10 km x 10 km. 1 Baseline Water Stress measures the ratio of total water withdrawals to available renewable surface and groundwater supplies. Water withdrawals include domestic, industrial, irrigation and livestock consumptive and non- consumptive uses. Available renewable water supplies include the impact of upstream consumptive water users and large dams on downstream water availability. Higher values indicate more competition among users. Interannual Variability measures the average between year variability of available water supply, including both renewable surface and groundwater supplies. Higher values indicate wider variations in available supply from year to year. Drought Risk measures where droughts are likely to occur, the population and assets exposed, and the vulnerability of the population and assets to adverse effects. Higher values indicate higher risk of drought. 1 Kuzma, S., M.F.P. Bierkens, S. Lakshman, T. Luo, L. Saccoccia, E. H. Sutanudjaja, and R. Van Beek. 2023. “Aqueduct 4.0: Updated decision-relevant global water risk indicators.” Technical Note. Washington, D.C.: World Resources Institute. Available online at: doi.org/10.46830/ writn.23.00061.
 2024 Investment Stewardship Report Page 71 Page 73