
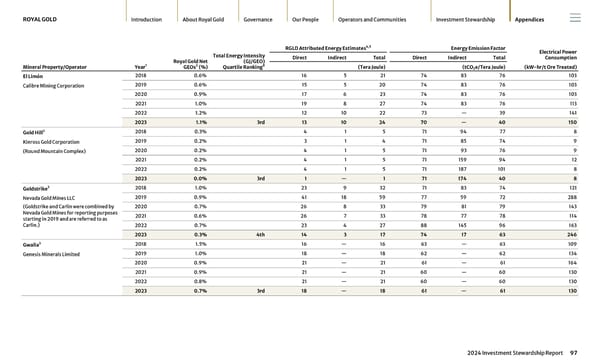
Mineral Property/Operator Year 1 Royal Gold Net GEOs 2 (%) Total Energy Intensity (GJ/GEO) Quartile Ranking 8 RGLD Attributed Energy Estimates 4,5 Energy Emission Factor Electrical Power Consumption (kW-hr/t Ore Treated) Direct Indirect Total Direct Indirect Total (Tera Joule) (tCO 2 e/Tera Joule) El Limón Calibre Mining Corporation 2018 0.6% 16 5 21 74 83 76 103 2019 0.6% 15 5 20 74 83 76 103 2020 0.9% 17 6 23 74 83 76 103 2021 1.0% 19 8 27 74 83 76 113 2022 1.2% 12 10 22 73 — 39 141 2023 1.1% 3rd 13 10 24 70 — 40 150 Gold Hill 3 Kinross Gold Corporation (Round Mountain Complex) 2018 0.3% 4 1 5 71 94 77 8 2019 0.2% 3 1 4 71 85 74 9 2020 0.2% 4 1 5 71 93 76 9 2021 0.2% 4 1 5 71 159 94 12 2022 0.2% 4 1 5 71 187 101 8 2023 0.0% 3rd 1 — 1 71 174 40 8 Goldstrike 3 Nevada Gold Mines LLC (Goldstrike and Carlin were combined by Nevada Gold Mines for reporting purposes starting in 2019 and are referred to as Carlin.) 2018 1.0% 23 9 32 71 83 74 121 2019 0.9% 41 18 59 77 59 72 288 2020 0.7% 26 8 33 79 81 79 143 2021 0.6% 26 7 33 78 77 78 114 2022 0.7% 23 4 27 88 145 96 163 2023 0.3% 4th 14 3 17 74 17 63 246 Gwalia 3 Genesis Minerals Limited 2018 1.5% 16 — 16 63 — 63 109 2019 1.0% 18 — 18 62 — 62 134 2020 0.9% 21 — 21 61 — 61 164 2021 0.9% 21 — 21 60 — 60 130 2022 0.8% 21 — 21 60 — 60 130 2023 0.7% 3rd 18 — 18 61 — 61 130 ROYAL GOLD Introduction About Royal Gold Governance Our People Operators and Communities Investment Stewardship Appendices 2024 Investment Stewardship Report 97
 2024 Investment Stewardship Report Page 96 Page 98