
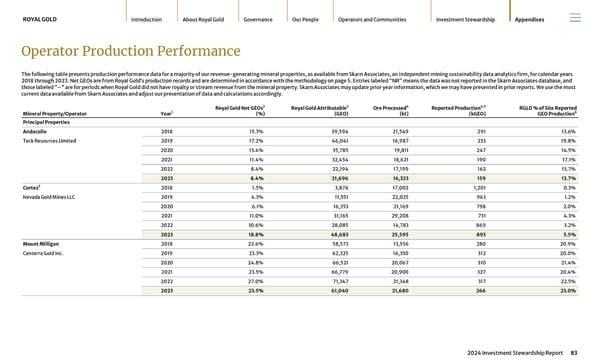
Operator Production Performance The following table presents production performance data for a majority of our revenue-generating mineral properties, as available from Skarn Associates, an independent mining sustainability data analytics firm, for calendar years 2018 through 2023. Net GEOs are from Royal Gold’s production records and are determined in accordance with the methodology on page 5 . Entries labeled “NR” means the data was not reported in the Skarn Associates database, and those labeled “–” are for periods when Royal Gold did not have royalty or stream revenue from the mineral property. Skarn Associates may update prior year information, which we may have presented in prior reports. We use the most current data available from Skarn Associates and adjust our presentation of data and calculations accordingly. Mineral Property/Operator Year 1 Royal Gold Net GEOs 2 (%) Royal Gold Attributable 2 (GEO) Ore Processed 4 (kt) Reported Production 4,5 (kGEO) RGLD % of Site Reported GEO Production 6 Principal Properties Andacollo Teck Resources Limited 2018 15.3% 39,594 21,549 291 13.6% 2019 17.2% 46,041 16,987 233 19.8% 2020 13.4% 35,785 19,811 247 14.5% 2021 11.4% 32,454 18,621 190 17.1% 2022 8.4% 22,194 17,199 162 13.7% 2023 8.4% 21,696 16,323 159 13.7% Cortez 3 Nevada Gold Mines LLC 2018 1.5% 3,876 17,002 1,201 0.3% 2019 4.3% 11,551 22,025 963 1.2% 2020 6.1% 16,353 21,169 798 2.0% 2021 11.0% 31,165 29,208 731 4.3% 2022 10.6% 28,085 14,783 869 3.2% 2023 18.8% 48,683 25,595 893 5.5% Mount Milligan Centerra Gold Inc. 2018 22.6% 58,573 13,556 280 20.9% 2019 23.3% 62,325 16,350 312 20.0% 2020 24.8% 66,521 20,067 310 21.4% 2021 23.5% 66,779 20,900 327 20.4% 2022 27.0% 71,347 21,348 317 22.5% 2023 23.5% 61,040 21,680 266 23.0% ROYAL GOLD Introduction About Royal Gold Governance Our People Operators and Communities Investment Stewardship Appendices 2024 Investment Stewardship Report 83
 2024 Investment Stewardship Report Page 82 Page 84