
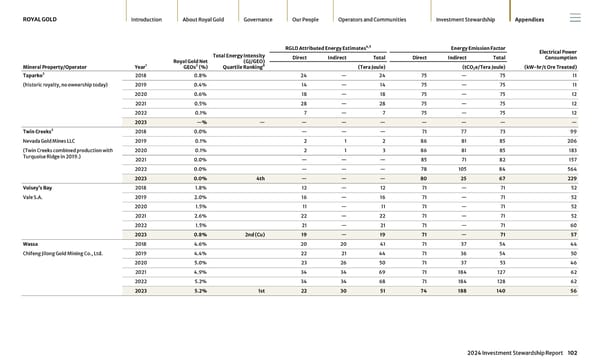
Mineral Property/Operator Year 1 Royal Gold Net GEOs 2 (%) Total Energy Intensity (GJ/GEO) Quartile Ranking 8 RGLD Attributed Energy Estimates 4,5 Energy Emission Factor Electrical Power Consumption (kW-hr/t Ore Treated) Direct Indirect Total Direct Indirect Total (Tera Joule) (tCO 2 e/Tera Joule) Taparko 3 (historic royalty, no ownership today) 2018 0.8% 24 — 24 75 — 75 11 2019 0.4% 14 — 14 75 — 75 11 2020 0.6% 18 — 18 75 — 75 12 2021 0.5% 28 — 28 75 — 75 12 2022 0.1% 7 — 7 75 — 75 12 2023 —% — — — — — — — — Twin Creeks 3 Nevada Gold Mines LLC (Twin Creeks combined production with Turquoise Ridge in 2019.) 2018 0.0% — — — 71 77 73 99 2019 0.1% 2 1 2 86 81 85 206 2020 0.1% 2 1 3 86 81 85 183 2021 0.0% — — — 85 71 82 157 2022 0.0% — — — 78 105 84 564 2023 0.0% 4th — — — 80 25 67 229 Voisey’s Bay Vale S.A. 2018 1.8% 12 — 12 71 — 71 52 2019 2.0% 16 — 16 71 — 71 52 2020 1.5% 11 — 11 71 — 71 52 2021 2.6% 22 — 22 71 — 71 52 2022 1.5% 21 — 21 71 — 71 60 2023 0.8% 2nd (Cu) 19 — 19 71 — 71 57 Wassa Chifeng Jilong Gold Mining Co., Ltd. 2018 4.6% 20 20 41 71 37 54 44 2019 4.4% 22 21 44 71 36 54 50 2020 5.0% 23 26 50 71 37 53 46 2021 4.9% 34 34 69 71 184 127 62 2022 5.2% 34 34 68 71 184 128 62 2023 5.2% 1st 22 30 51 74 188 140 56 ROYAL GOLD Introduction About Royal Gold Governance Our People Operators and Communities Investment Stewardship Appendices 2024 Investment Stewardship Report 102
 2024 Investment Stewardship Report Page 101 Page 103