
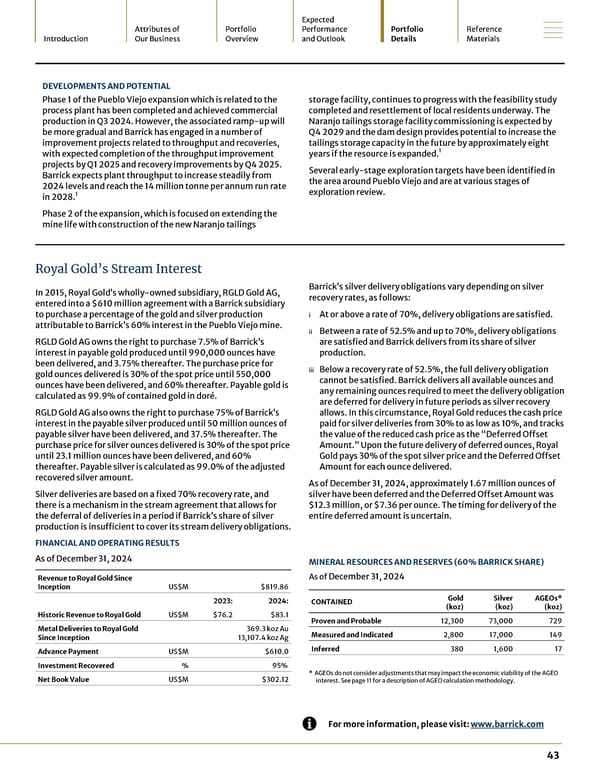
DEVELOPMENTS AND POTENTIAL Phase 1 of the Pueblo Viejo expansion which is related to the process plant has been completed and achieved commercial production in Q3 2024. However, the associated ramp-up will be more gradual and Barrick has engaged in a number of improvement projects related to throughput and recoveries, with expected completion of the throughput improvement projects by Q1 2025 and recovery improvements by Q4 2025. Barrick expects plant throughput to increase steadily from 2024 levels and reach the 14 million tonne per annum run rate in 2028. 1 Phase 2 of the expansion, which is focused on extending the mine life with construction of the new Naranjo tailings storage facility, continues to progress with the feasibility study completed and resettlement of local residents underway. The Naranjo tailings storage facility commissioning is expected by Q4 2029 and the dam design provides potential to increase the tailings storage capacity in the future by approximately eight years if the resource is expanded. 1 Several early-stage exploration targets have been identified in the area around Pueblo Viejo and are at various stages of exploration review. Royal Gold’s Stream Interest In 2015, Royal Gold’s wholly-owned subsidiary, RGLD Gold AG, entered into a $610 million agreement with a Barrick subsidiary to purchase a percentage of the gold and silver production attributable to Barrick’s 60% interest in the Pueblo Viejo mine. RGLD Gold AG owns the right to purchase 7.5% of Barrick’s interest in payable gold produced until 990,000 ounces have been delivered, and 3.75% thereafter. The purchase price for gold ounces delivered is 30% of the spot price until 550,000 ounces have been delivered, and 60% thereafter. Payable gold is calculated as 99.9% of contained gold in doré. RGLD Gold AG also owns the right to purchase 75% of Barrick’s interest in the payable silver produced until 50 million ounces of payable silver have been delivered, and 37.5% thereafter. The purchase price for silver ounces delivered is 30% of the spot price until 23.1 million ounces have been delivered, and 60% thereafter. Payable silver is calculated as 99.0% of the adjusted recovered silver amount. Silver deliveries are based on a fixed 70% recovery rate, and there is a mechanism in the stream agreement that allows for the deferral of deliveries in a period if Barrick’s share of silver production is insufficient to cover its stream delivery obligations. Barrick’s silver delivery obligations vary depending on silver recovery rates, as follows: i At or above a rate of 70%, delivery obligations are satisfied. ii Between a rate of 52.5% and up to 70%, delivery obligations are satisfied and Barrick delivers from its share of silver production. iii Below a recovery rate of 52.5%, the full delivery obligation cannot be satisfied. Barrick delivers all available ounces and any remaining ounces required to meet the delivery obligation are deferred for delivery in future periods as silver recovery allows. In this circumstance, Royal Gold reduces the cash price paid for silver deliveries from 30% to as low as 10%, and tracks the value of the reduced cash price as the “Deferred Offset Amount.” Upon the future delivery of deferred ounces, Royal Gold pays 30% of the spot silver price and the Deferred Offset Amount for each ounce delivered. As of December 31, 2024, approximately 1.67 million ounces of silver have been deferred and the Deferred Offset Amount was $12.3 million, or $7.36 per ounce. The timing for delivery of the entire deferred amount is uncertain. FINANCIAL AND OPERATING RESULTS As of December 31, 2024 Revenue to Royal Gold Since Inception US$M $819.86 2023: 2024: Historic Revenue to Royal Gold US$M $76.2 $83.1 Metal Deliveries to Royal Gold Since Inception 369.3 koz Au 13,107.4 koz Ag Advance Payment US$M $610.0 Investment Recovered % 95% Net Book Value US$M $302.12 MINERAL RESOURCES AND RESERVES (60% BARRICK SHARE) As of December 31, 2024 CONTAINED Gold (koz) Silver (koz) AGEOs * (koz) Proven and Probable 12,300 73,000 729 Measured and Indicated 2,800 17,000 149 Inferred 380 1,600 17 * AGEOs do not consider adjustments that may impact the economic viability of the AGEO interest. See page 11 for a description of AGEO calculation methodology. Introduction Attributes of Our Business Portfolio Overview Expected Performance and Outlook Portfolio Details Reference Materials 43 For more information, please visit: www.barrick.com
 2024 Asset Handbook Page 42 Page 44