
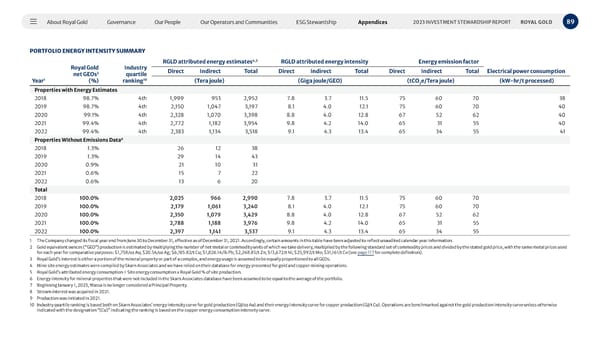
About Royal Gold Governance Our People Our Operators and Communities ESG Stewardship Appendices 89 2023 INVESTMENT STEWARDSHIP REPORT ROYAL GOLD PORTFOLIO ENERGY INTENSITY SUMMARY Year 1 Royal Gold net GEOs 2 (%) Industry quartile ranking 10 RGLD attributed energy estimates 4,5 RGLD attributed energy intensity Energy emission factor Direct Indirect Total Direct Indirect Total Direct Indirect Total Electrical power consumption (Tera joule) (Giga joule/GEO) (tCO 2 e/Tera joule) (kW-hr/t processed) Properties with Energy Estimates 2018 98.7% 4th 1,999 953 2,952 7.8 3.7 11.5 75 60 70 38 2019 98.7% 4th 2,150 1,047 3,197 8.1 4.0 12.1 75 60 70 40 2020 99.1% 4th 2,328 1,070 3,398 8.8 4.0 12.8 67 52 62 40 2021 99.4% 4th 2,772 1,182 3,954 9.8 4.2 14.0 65 31 55 40 2022 99.4% 4th 2,383 1,134 3,518 9.1 4.3 13.4 65 34 55 41 Properties Without Emissions Data 6 2018 1.3% 26 12 38 2019 1.3% 29 14 43 2020 0.9% 21 10 31 2021 0.6% 15 7 22 2022 0.6% 13 6 20 Total 2018 100.0% 2,025 966 2,990 7.8 3.7 11.5 75 60 70 2019 100.0% 2,179 1,061 3,240 8.1 4.0 12.1 75 60 70 2020 100.0% 2,350 1,079 3,429 8.8 4.0 12.8 67 52 62 2021 100.0% 2,788 1,188 3,976 9.8 4.2 14.0 65 31 55 2022 100.0% 2,397 1,141 3,537 9.1 4.3 13.4 65 34 55 1 The Company changed its fiscal year end from June 30 to December 31, effective as of December 31, 2021. Accordingly, certain amounts in this table have been adjusted to reflect unaudited calendar year information. 2 Gold equivalent ounces (“GEO”) production is estimated by multiplying the number of net metal or commodity units of which we take delivery, multiplied by the following standard set of commodity prices and divided by the stated gold price, with the same metal prices used for each year for comparative purposes: $1,758/oz Au; $20.54/oz Ag; $6,185.82/t Cu; $1,826.14/lb Pb; $2,268.85/t Zn; $13,672/t Ni; $25,992/t Mo; $31,161/t Co (see page 117 for complete definition). 3 Royal Gold’s interest is either a portion of the mineral property or part of a complex, and energy usage is assumed to be equally proportioned to all GEOs. 4 Mine site energy estimates were compiled by Skarn Associates and we have relied on their database for energy presented for gold and copper mining operations. 5 Royal Gold’s attributed energy consumption = Site energy consumption x Royal Gold % of site production. 6 Energy intensity for mineral properties that were not included in the Skarn Associates database have been assumed to be equal to the average of the portfolio. 7 Beginning January 1, 2023, Wassa is no longer considered a Principal Property. 8 Stream interest was acquired in 2021. 9 Production was initiated in 2021. 10 Industry quartile ranking is based both on Skarn Associates’ energy intensity curve for gold production (GJ/oz Au) and their energy intensity curve for copper production (GJ/t Cu). Operations are benchmarked against the gold production intensity curve unless otherwise indicated with the designation “(Cu)” indicating the ranking is based on the copper energy consumption intensity curve.
 2023 Investment Stewardship Report Page 88 Page 90