
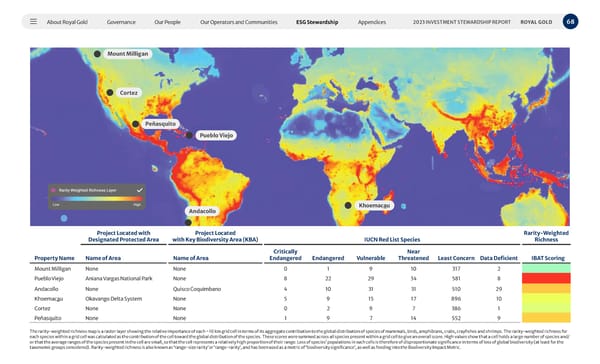
About Royal Gold Governance Our People Our Operators and Communities ESG Stewardship Appendices 68 2023 INVESTMENT STEWARDSHIP REPORT ROYAL GOLD Project Located with Designated Protected Area Project Located with Key Biodiversity Area (KBA) IUCN Red List Species Rarity-Weighted Richness Property Name Name of Area Name of Area Critically Endangered Endangered Vulnerable Near Threatened Least Concern Data Deficient IBAT Scoring Mount Milligan None None 0 1 9 10 317 2 Pueblo Viejo Aniana Vargas National Park None 8 22 29 34 581 8 Andacollo None Quisco Coquimbano 4 10 31 31 510 29 Khoemac a u Okavango Delta System None 5 9 15 17 896 10 Cortez None None 0 2 9 7 386 1 Peñasquito None None 1 9 7 14 552 9 The rarity-weighted richness map is a raster layer showing the relative importance of each ~10 km grid cell in terms of its aggregate contribution to the global distribution of species of mammals, birds, amphibians, crabs, crayfishes and shrimps. The rarity-weighted richness for each species within a grid cell was calculated as the contribution of the cell toward the global distribution of the species. These scores were summed across all species present within a grid cell to give an overall score. High values show that a cell holds a large number of species and/ or that the average ranges of the species present in the cell are small, so that the cell represents a relatively high proportion of their range. Loss of species’ populations in such cells is therefore of disproportionate significance in terms of loss of global biodiversity (at least for the taxonomic groups considered). Rarity-weighted richness is also known as ‘range-size rarity’ or ‘range-rarity’, and has been used as a metric of ‘biodiversity significance’, as well as feeding into the Biodiversity Impact Metric. Mount Milligan Cortez Peñasquito Pueblo Viejo Andacollo Khoemac a u
 2023 Investment Stewardship Report Page 67 Page 69