
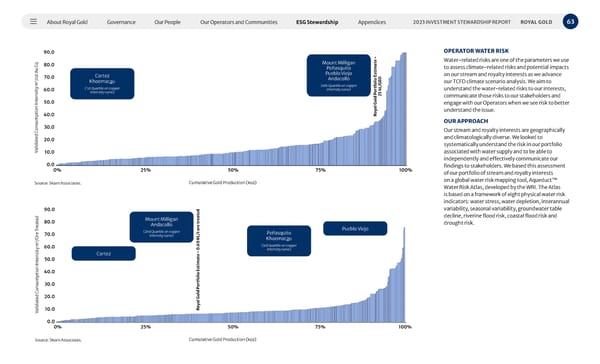
About Royal Gold Governance Our People Our Operators and Communities ESG Stewardship Appendices 63 2023 INVESTMENT STEWARDSHIP REPORT ROYAL GOLD Validated Consumption Intensity m 3 /oz Au Eq Royal Gold Portfolio Estimate - 25 kL/GEO Cumulative Gold Production (koz) Source: Skarn Associates. 90.0 80.0 70.0 60.0 50.0 40.0 30.0 20.0 10.0 0.0 0% 25% 50% 75% 100% Cortez Khoemacau (1st Quartile on copper intensity curve) Mount Milligan Peñasquito Pueblo Viejo Andacollo (4th Quartile on copper intensity curve) Validated Consumption Intensity m 3 /Ore Treated Royal Gold Portfolio Estimate - 0.60 KL/t ore treated Cumulative Gold Production (koz) Source: Skarn Associates. 90.0 80.0 70.0 60.0 50.0 40.0 30.0 20.0 10.0 0.0 0% 25% 50% 75% 100% Mount Milligan Andacollo (2nd Quartile on copper intensity curve) Peñasquito Khoemacau (3rd Quartile on copper intensity curve) Cortez Pueblo Viejo OPERATOR WATER RISK Water-related risks are one of the parameters we use to assess climate-related risks and potential impacts on our stream and royalty interests as we advance our TCFD climate scenario analysis. We aim to understand the water-related risks to our interests, communicate those risks to our stakeholders and engage with our Operators when we see risk to better understand the issue. OUR APPROACH Our stream and royalty interests are geographically and climatologically diverse. We looked to systematically understand the risk in our portfolio associated with water supply and to be able to independently and effectively communicate our findings to stakeholders. We based this assessment of our portfolio of stream and royalty interests on a global water risk mapping tool, Aqueduct™ Water Risk Atlas, developed by the WRI. The Atlas is based on a framework of eight physical water risk indicators: water stress, water depletion, interannual variability, seasonal variability, groundwater table decline, riverine flood risk, coastal flood risk and drought risk.
 2023 Investment Stewardship Report Page 62 Page 64