
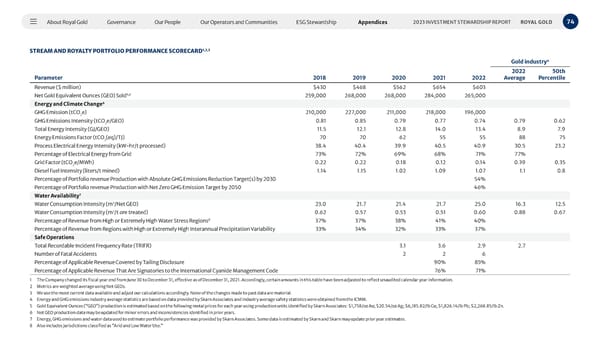
About Royal Gold Governance Our People Our Operators and Communities ESG Stewardship Appendices 74 2023 INVESTMENT STEWARDSHIP REPORT ROYAL GOLD STREAM AND ROYALTY PORTFOLIO PERFORMANCE SCORECARD 1,2,3 Gold industry 4 Parameter 2018 2019 2020 2021 2022 2022 Average 50th Percentile Revenue ($ million) $430 $468 $562 $654 $603 Net Gold Equivalent Ounces (GEO) Sold 5,6 259,000 268,000 268,000 284,000 265,000 Energy and Climate Change 6 GHG Emission (tCO 2 e) 210,000 227,000 211,000 218,000 196,000 GHG Emissions Intensity (tCO 2 e/GEO) 0.81 0.85 0.79 0.77 0.74 0.79 0.62 Total Energy Intensity (GJ/GEO) 11.5 12.1 12.8 14.0 13.4 8.9 7.9 Energy Emissions Factor (tCO 2 (eq)/TJ) 70 70 62 55 55 88 75 Process Electrical Energy Intensity (kW-hr/t processed) 38.4 40.4 39.9 40.5 40.9 30.5 23.2 Percentage of Electrical Energy from Grid 73% 72% 69% 68% 71% 77% Grid Factor (tCO 2 e/MWh) 0.22 0.22 0.18 0.12 0.14 0.39 0.35 Diesel Fuel Intensity (liters/t mined) 1.14 1.15 1.02 1.09 1.07 1.1 0.8 Percentage of Portfolio revenue Production with Absolute GHG Emissions Reduction Target(s) by 2030 54% Percentage of Portfolio revenue Production with Net Zero GHG Emission Target by 2050 46% Water Availability 7 Water Consumption Intensity (m 3 /Net GEO) 23.0 21.7 21.4 21.7 25.0 16.3 12.5 Water Consumption Intensity (m 3 /t ore treated) 0.62 0.57 0.53 0.51 0.60 0.88 0.67 Percentage of Revenue from High or Extremely High Water Stress Regions 8 37% 37% 38% 41% 40% Percentage of Revenue from Regions with High or Extremely High Interannual Precipitation Variability 33% 34% 32% 33% 37% Safe Operations Total Recordable Incident Frequency Rate (TRIFR) 3.1 3.6 2.9 2.7 Number of Fatal Accidents 2 2 6 Percentage of Applicable Revenue Covered by Tailing Disclosure 90% 85% Percentage of Applicable Revenue That Are Signatories to the International Cyanide Management Code 76% 71% 1 The Company changed its fiscal year end from June 30 to December 31, effective as of December 31, 2021. Accordingly, certain amounts in this table have been adjusted to reflect unaudited calendar year information. 2 Metrics are weighted average using Net GEOs. 3 We use the most current data available and adjust our calculations accordingly. None of the changes made to past data are material. 4 Energy and GHG emissions industry average statistics are based on data provided by Skarn Associates and industry average safety statistics were obtained from the ICMM. 5 Gold Equivalent Ounces (“GEO”) production is estimated based on the following metal prices for each year using production units identified by Skarn Associates: $1,758/oz Au; $20.54/oz Ag; $6,185.82/lb Cu; $1,826.14/lb Pb; $2,268.85/lb Zn. 6 Net GEO production data may be updated for minor errors and inconsistencies identified in prior years. 7 Energy, GHG emissions and water data used to estimate portfolio performance was provided by Skarn Associates. Some data is estimated by Skarn and Skarn may update prior year estimates. 8 Also includes jurisdictions classified as “Arid and Low Water Use.”
 2023 Investment Stewardship Report Page 73 Page 75