
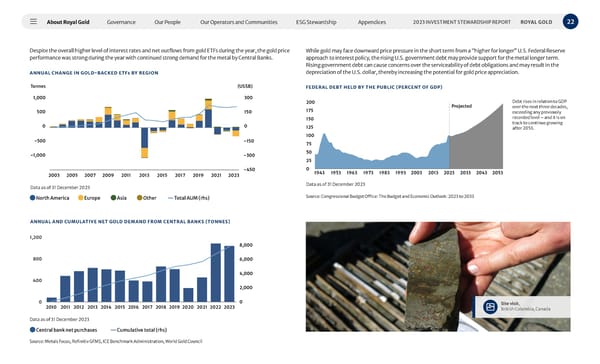
About Royal Gold Governance Our People Our Operators and Communities ESG Stewardship Appendices 22 2023 INVESTMENT STEWARDSHIP REPORT ROYAL GOLD Despite the overall higher level of interest rates and net outflows from gold ETFs during the year, the gold price performance was strong during the year with continued strong demand for the metal by Central Banks. ANNUAL CHANGE IN GOLD-BACKED ETF s BY REGION 2003 2005 2007 2009 2011 2013 2015 2017 2019 2021 2023 Data as of 31 December 2023 0 150 300 -450 -300 -150 (US$B) Tonnes 1,000 -500 0 500 -1,000 North America Europe Asia Other Total AUM (rhs) ANNUAL AND CUMULATIVE NET GOLD DEMAND FROM CENTRAL BANKS (TONNES) 2010 2011 2012 2013 2014 2015 2016 2017 2018 2023 Data as of 31 December 2023 0 400 800 1,200 0 2,000 4,000 6,000 8,000 2019 2020 2021 2022 Source: Metals Focus, Refinitiv GFMS, ICE Benchmark Administration, World Gold Council While gold may face downward price pressure in the short term from a “higher for longer” U.S. Federal Reserve approach to interest policy, the rising U.S. government debt may provide support for the metal longer term. Rising government debt can cause concerns over the serviceability of debt obligations and may result in the depreciation of the U.S. dollar, thereby increasing the potential for gold price appreciation. FEDERAL DEBT HELD BY THE PUBLIC (PERCENT OF GDP) Central bank net purchases Cumulative total (rhs) 1943 1953 1963 1973 1983 1993 2003 2013 2023 2033 2053 2043 0 25 50 75 100 125 150 175 200 0 25 50 75 100 125 150 175 200 Data as of 31 December 2023 Projected Source: Congressional Budget Office: The Budget and Economic Outlook: 2023 to 2033 Debt rises in relation to GDP over the next three decades, exceeding any previously recorded level – and it is on track to continue growing after 2053. Site visit , British Columbia, Canada
 2023 Investment Stewardship Report Page 21 Page 23