
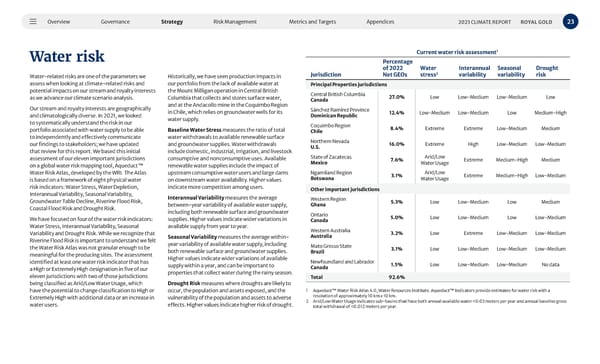
Overview Governance Strategy Risk Management Metrics and Targets Appendices 23 2023 CLIMATE REPORT ROYAL GOLD Water risk Water-related risks are one of the parameters we assess when looking at climate-related risks and potential impacts on our stream and royalty interests as we advance our climate scenario analysis. Our stream and royalty interests are geographically and climatologically diverse. In 2021, we looked to systematically understand the risk in our portfolio associated with water supply to be able to independently and effectively communicate our findings to stakeholders; we have updated that review for this report. We based this initial assessment of our eleven important jurisdictions on a global water risk mapping tool, Aqueduct™ Water Risk Atlas, developed by the WRI. The Atlas is based on a framework of eight physical water risk indicators: Water Stress, Water Depletion, Interannual Variability, Seasonal Variability, Groundwater Table Decline, Riverine Flood Risk, Coastal Flood Risk and Drought Risk. We have focused on four of the water risk indicators: Water Stress, Interannual Variability, Seasonal Variability and Drought Risk. While we recognize that Riverine Flood Risk is important to understand we felt the Water Risk Atlas was not granular enough to be meaningful for the producing sites. The assessment identified at least one water risk indicator that has a High or Extremely High designation in five of our eleven jurisdictions with two of those jurisdictions being classified as Arid/Low Water Usage, which have the potential to change classification to High or Extremely High with additional data or an increase in water users. Historically, we have seen production impacts in our portfolio from the lack of available water at the Mount Milligan operation in Central British Columbia that collects and stores surface water, and at the Andacollo mine in the Coquimbo Region in Chile, which relies on groundwater wells for its water supply. Baseline Water Stress measures the ratio of total water withdrawals to available renewable surface and groundwater supplies. Water withdrawals include domestic, industrial, irrigation, and livestock consumptive and nonconsumptive uses. Available renewable water supplies include the impact of upstream consumptive water users and large dams on downstream water availability. Higher values indicate more competition among users. Interannual Variability measures the average between-year variability of available water supply, including both renewable surface and groundwater supplies. Higher values indicate wider variations in available supply from year to year. Seasonal Variability measures the average within- year variability of available water supply, including both renewable surface and groundwater supplies. Higher values indicate wider variations of available supply within a year, and can be important to properties that collect water during the rainy season. Drought Risk measures where droughts are likely to occur, the population and assets exposed, and the vulnerability of the population and assets to adverse effects. Higher values indicate higher risk of drought. Current water risk assessment 1 Jurisdiction Percentage of 2022 Net GEOs Water stress 2 Interannual variability Seasonal variability Drought risk Principal Properties jurisdictions Central British Columbia Canada 27.0% Low Low-Medium Low-Medium Low Sánchez Ramírez Province Dominican Republic 12.4% Low-Medium Low-Medium Low Medium-High Coquimbo Region Chile 8.4% Extreme Extreme Low-Medium Medium Northern Nevada U.S. 16.0% Extreme High Low-Medium Low-Medium State of Zacatecas Mexico 7.6% Arid/Low Water Usage Extreme Medium-High Medium Ngamiland Region Botswana 3.1% Arid/Low Water Usage Extreme Medium-High Low-Medium Other important jurisdictions Western Region Ghana 5.3% Low Low-Medium Low Medium Ontario Canada 5.0% Low Low-Medium Low Low-Medium Western Australia Australia 3.2% Low Extreme Low-Medium Low-Medium Mato Grosso State Brazil 3.1% Low Low-Medium Low-Medium Low-Medium Newfoundland and Labrador Canada 1.5% Low Low-Medium Low-Medium No data Total 92.6% 1 Aqueduct™ Water Risk Atlas 4.0, Water Resources Institute. Aqueduct™ Indicators provide estimates for water risk with a resolution of approximately 10 km x 10 km. 2 Arid/Low Water Usage indicates sub-basins that have both annual available water <0.03 meters per year and annual baseline gross total withdrawal of <0.012 meters per year.
 2023 Climate Report Page 22 Page 24