
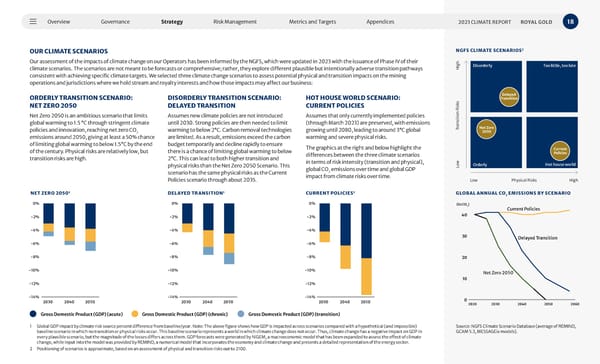
Overview Governance Strategy Risk Management Metrics and Targets Appendices 18 2023 CLIMATE REPORT ROYAL GOLD OUR CLIMATE SCENARIOS Our assessment of the impacts of climate change on our Operators has been informed by the NGFS, which were updated in 2023 with the issuance of Phase IV of their climate scenarios. The scenarios are not meant to be forecasts or comprehensive; rather, they explore different plausible but intentionally adverse transition pathways consistent with achieving specific climate targets. We selected three climate change scenarios to assess potential physical and transition impacts on the mining operations and jurisdictions where we hold stream and royalty interests and how those impacts may affect our business: ORDERLY TRANSITION SCENARIO: NET ZERO 2050 Net Zero 2050 is an ambitious scenario that limits global warming to 1.5 °C through stringent climate policies and innovation, reaching net zero CO 2 emissions around 2050, giving at least a 50% chance of limiting global warming to below 1.5°C by the end of the century. Physical risks are relatively low, but transition risks are high. DISORDERLY TRANSITION SCENARIO: DELAYED TRANSITION Assumes new climate policies are not introduced until 2030. Strong policies are then needed to limit warming to below 2°C. Carbon removal technologies are limited. As a result, emissions exceed the carbon budget temporarily and decline rapidly to ensure there is a chance of limiting global warming to below 2°C. This can lead to both higher transition and physical risks than the Net Zero 2050 Scenario. This scenario has the same physical risks as the Current Policies scenario through about 2035. HOT HOUSE WORLD SCENARIO: CURRENT POLICIES Assumes that only currently implemented policies (through March 2023) are preserved, with emissions growing until 2080, leading to around 3°C global warming and severe physical risks. The graphics at the right and below highlight the differences between the three climate scenarios in terms of risk intensity (transition and physical), global CO 2 emissions over time and global GDP impact from climate risks over time. NET ZERO 2050 1 2030 2040 2050 -14% -12% -10% -8% -6% -4% -2% 0% 87.0 87.1 93.5 -14% -12% -10% -8% -6% -4% -2% 0% -14% -12% -10% -8% -6% -4% -2% 0% 2030 2040 2050 2030 2040 2050 DEL AYED TR ANSITION 1 2030 2040 2050 -14% -12% -10% -8% -6% -4% -2% 0% 87.0 87.1 93.5 -14% -12% -10% -8% -6% -4% -2% 0% -14% -12% -10% -8% -6% -4% -2% 0% 2030 2040 2050 2030 2040 2050 CURRENT POLICIES 1 2030 2040 2050 -14% -12% -10% -8% -6% -4% -2% 0% 87.0 87.1 93.5 -14% -12% -10% -8% -6% -4% -2% 0% -14% -12% -10% -8% -6% -4% -2% 0% 2030 2040 2050 2030 2040 2050 1 Global GDP impact by climate risk source percent difference from baseline/year. Note: The above figure shows how GDP is impacted across scenarios compared with a hypothetical (and impossible) baseline scenario in which no transition or physical risks occur. This baseline scenario represents a world in which climate change does not occur. Thus, climate change has a negative impact on GDP in every plausible scenario, but the magnitude of the losses differs across them. GDP forecasts were generated by NiGEM, a macroeconomic model that has been expanded to assess the effect of climate change, while input into the model was provided by REMIND, a numerical model that incorporates the economy and climate change and presents a detailed representation of the energy sector. 2 Positioning of scenarios is approximate, based on an assessment of physical and transition risks out to 2100. Gross Domestic Product (GDP) (acute) Gross Domestic Product (GDP) (chronic) Gross Domestic Product (GDP) (transition) NGFS CLIM ATE SCENARIOS 2 High High Low Low Physical Risks Disorderly Orderly Too little, too late Hot house world Transition Risks Delayed Transition Net Zero 2050 Current Policies GLOBAL ANNUAL CO 2 EMISSIONS BY SCENARIO 0 10 20 30 40 50 2020 2030 (Gt CO 2 ) 2040 2050 2060 Net Zero 2050 Delayed Transition Current Policies Source: NGFS Climate Scenario Database, (average of REMIND, GVAM 5.3, MESSAGE ix models) Current Policies Delayed Transition Net Zero 2050 Source: NGFS Climate Scenario Database (average of REMIND, GCAM 5.3, MESSAGEix models).
 2023 Climate Report Page 17 Page 19