
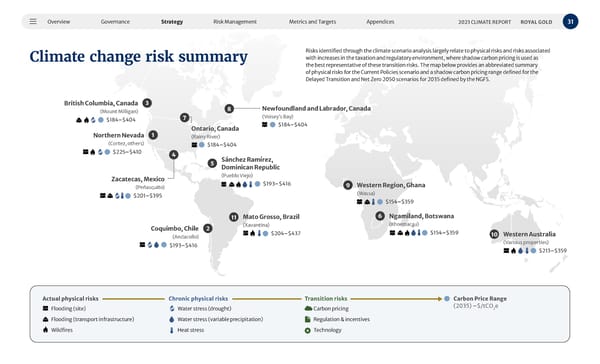
2 4 5 3 6 7 8 9 1 10 11 2 4 5 3 6 7 8 9 1 10 11 31 2023 CLIMATE REPORT ROYAL GOLD Overview Governance Strategy Risk Management Metrics and Targets Appendices Climate change risk summary Coquimbo, Chile (Andacollo) Northern Nevada (Cortez, others) British Columbia, Canada (Mount Milligan) Zacatecas, Mexico (Peñasquito) Sánchez Ramírez, Dominican Republic (Pueblo Viejo) Ngamiland, Botswana ( Khoemac a u ) Western Region, Ghana (Wassa) Western Australia (Various properties) Mato Grosso, Brazil (Xavantina) Newfoundland and Labrador, Canada (Voisey’s Bay) Actual physical risks Flooding (site) Flooding (transport infrastructure) Wildfires Chronic physical risks Water stress (drought) Water stress (variable precipitation) Heat stress Transition risks Carbon pricing Regulation & incentives Technology Carbon Price Range (2035) –$/tCO 2 e Ontario, Canada (Rainy River) $225–$410 $184–$404 $201–$395 $193–$416 $184–$404 $193–$416 $204–$437 $154–$359 $154–$359 $213–$359 $184–$404 Risks identified through the climate scenario analysis largely relate to physical risks and risks associated with increases in the taxation and regulatory environment, where shadow carbon pricing is used as the best representative of these transition risks. The map below provides an abbreviated summary of physical risks for the Current Policies scenario and a shadow carbon pricing range defined for the Delayed Transition and Net Zero 2050 scenarios for 2035 defined by the NGFS.
 2023 Climate Report Page 30 Page 32