
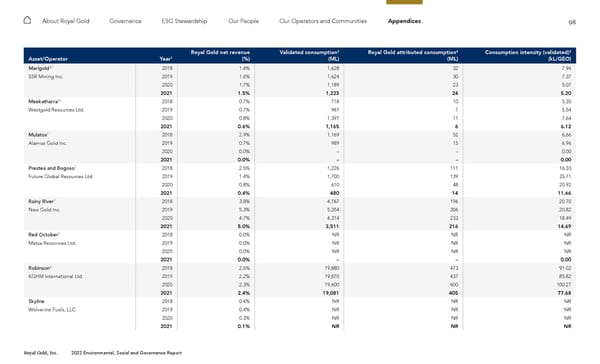
98 Royal Gold, Inc. 2022 Environmental, Social and Governance Report About Royal Gold Governance ESG Stewardship Our People Our Operators and Communities Appendices Asset/Operator Year 1 Royal Gold net revenue (%) Validated consumption 2 (ML) Royal Gold attributed consumption 4 (ML) Consumption intensity (validated) 2 (kL/GEO) Marigold 3,7 2018 1.4% 1,628 32 7.94 SSR Mining Inc. 2019 1.6% 1,624 30 7.37 2020 1.7% 1,189 23 5.07 2021 1.5% 1,223 24 5.20 Meekatharra 3,7 2018 0.7% 718 10 5.35 Westgold Resources Ltd. 2019 0.7% 961 7 5.54 2020 0.8% 1,397 11 7.64 2021 0.6% 1,165 6 6.12 Mulatos 7 2018 2.9% 1,169 52 6.66 Alamos Gold Inc. 2019 0.7% 989 15 6.96 2020 0.0% – – 0.00 2021 0.0% – – 0.00 Prestea and Bogoso 7 2018 2.5% 1,226 111 16.33 Future Global Resources Ltd. 2019 1.4% 1,700 139 35.71 2020 0.8% 610 48 20.92 2021 0.4% 480 14 11.66 Rainy River 7 2018 3.8% 4,767 196 20.70 New Gold Inc. 2019 5.3% 5,354 306 20.82 2020 4.7% 4,314 233 18.49 2021 5.0% 3,511 216 14.69 Red October 7 2018 0.0% NR NR NR Matsa Resources Ltd. 2019 0.0% NR NR NR 2020 0.0% NR NR NR 2021 0.0% – – 0.00 Robinson 8 2018 2.6% 19,880 473 91.02 KGHM International Ltd. 2019 2.2% 19,870 437 85.82 2020 2.3% 19,600 600 100.27 2021 2.4% 19,081 405 77.68 Skyline 2018 0.4% NR NR NR Wolverine Fuels, LLC 2019 0.4% NR NR NR 2020 0.3% NR NR NR 2021 0.1% NR NR NR
 2022 ESG Report Page 97 Page 99