
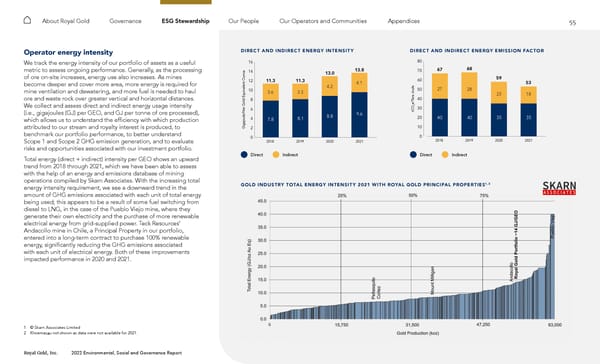
55 Royal Gold, Inc. 2022 Environmental, Social and Governance Report About Royal Gold Governance ESG Stewardship Our People Our Operators and Communities Appendices Operator energy intensity We track the energy intensity of our portfolio of assets as a useful metric to assess ongoing performance. Generally, as the processing of ore on-site increases, energy use also increases. As mines become deeper and cover more area, more energy is required for mine ventilation and dewatering, and more fuel is needed to haul ore and waste rock over greater vertical and horizontal distances. We collect and assess direct and indirect energy usage intensity (i.e., gigajoules (GJ) per GEO, and GJ per tonne of ore processed), which allows us to understand the efficiency with which production attributed to our stream and royalty interest is produced, to benchmark our portfolio performance, to better understand Scope 1 and Scope 2 GHG emission generation, and to evaluate risks and opportunities associated with our investment portfolio. Total energy (direct + indirect) intensity per GEO shows an upward trend from 2018 through 2021, which we have been able to assess with the help of an energy and emissions database of mining operations compiled by Skarn Associates. With the increasing total energy intensity requirement, we see a downward trend in the amount of GHG emissions associated with each unit of total energy being used; this appears to be a result of some fuel switching from diesel to LNG, in the case of the Pueblo Viejo mine, where they generate their own electricity and the purchase of more renewable electrical energy from grid-supplied power. Teck Resources’ Andacollo mine in Chile, a Principal Property in our portfolio, entered into a long-term contract to purchase 100% renewable energy, significantly reducing the GHG emissions associated with each unit of electrical energy. Both of these improvements impacted performance in 2020 and 2021. DIREC T AND INDIREC T ENERGY INTENSIT Y 0 2 4 6 8 10 12 14 16 2020 2021 2019 2018 7.8 8.1 8.8 9.6 3.6 3.3 4.2 4.1 11.3 11.3 13.0 13.8 Gigajoule/Net Gold Equivalent Ounce Direct Indirect DIREC T AND INDIREC T ENERGY EMISSION FAC TOR 0 10 20 30 40 50 60 70 80 2020 2021 2019 2018 40 40 35 35 27 28 23 18 67 68 59 53 tCO 2 e/Tera Joule Direct Indirect GOLD INDUS TRY TOTAL ENERGY INTENSIT Y 2021 WITH ROYAL GOLD PR INCIPAL PROPER TIES 1, 2 1 © Skarn Associates Limited 2 Khoemac a u not shown as data were not available for 2021. Direct Direct Indirect Indirect
 2022 ESG Report Page 54 Page 56