
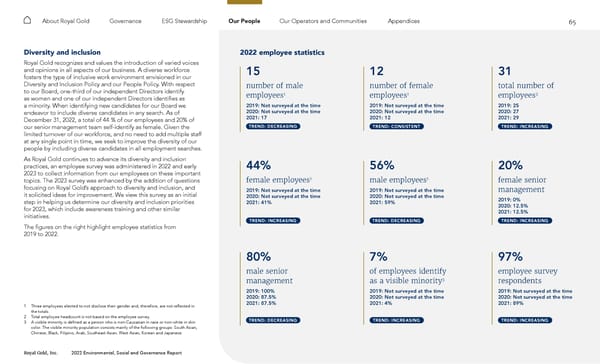
65 Royal Gold, Inc. 2022 Environmental, Social and Governance Report About Royal Gold Governance ESG Stewardship Our People Our Operators and Communities Appendices Diversity and inclusion Royal Gold recognizes and values the introduction of varied voices and opinions in all aspects of our business. A diverse workforce fosters the type of inclusive work environment envisioned in our Diversity and Inclusion Policy and our People Policy. With respect to our Board, one-third of our independent Directors identify as women and one of our independent Directors identifies as a minority. When identifying new candidates for our Board we endeavor to include diverse candidates in any search. As of December 31, 2022, a total of 44 % of our employees and 20% of our senior management team self-identify as female. Given the limited turnover of our workforce, and no need to add multiple staff at any single point in time, we seek to improve the diversity of our people by including diverse candidates in all employment searches. As Royal Gold continues to advance its diversity and inclusion practices, an employee survey was administered in 2022 and early 2023 to collect information from our employees on these important topics. The 2023 survey was enhanced by the addition of questions focusing on Royal Gold’s approach to diversity and inclusion, and it solicited ideas for improvement. We view this survey as an initial step in helping us determine our diversity and inclusion priorities for 2023, which include awareness training and other similar initiatives. The figures on the right highlight employee statistics from 2019 to 2022. 2022 employee statistics 15 number of male employees 1 2019: Not surveyed at the time 2020: Not surveyed at the time 2021: 17 TREND: DECREASING 12 number of female employees 1 2019: Not surveyed at the time 2020: Not surveyed at the time 2021: 12 TREND: CONSISTENT 31 total number of employees 2 2019: 25 2020: 27 2021: 29 TREND: INCREASING 44% female employees 1 2019: Not surveyed at the time 2020: Not surveyed at the time 2021: 41% TREND: INCREASING 56% male employees 1 2019: Not surveyed at the time 2020: Not surveyed at the time 2021: 59% TREND: DECREASING 20% female senior management 2019: 0% 2020: 12.5% 2021: 12.5% TREND: INCREASING 80% male senior management 2019: 100% 2020: 87.5% 2021: 87.5% TREND: DECREASING 7% of employees identify as a visible minority 3 2019: Not surveyed at the time 2020: Not surveyed at the time 2021: 4% TREND: INCREASING 97% employee survey respondents 2019: Not surveyed at the time 2020: Not surveyed at the time 2021: 89% TREND: INCREASING 1 Three employees elected to not disclose their gender and, therefore, are not reflected in the totals. 2 Total employee headcount is not based on the employee survey. 3 A visible minority is defined as a person who is non-Caucasian in race or non-white in skin color. The visible minority population consists mainly of the following groups: South Asian, Chinese, Black, Filipino, Arab, Southeast Asian, West Asian, Korean and Japanese.
 2022 ESG Report Page 64 Page 66