
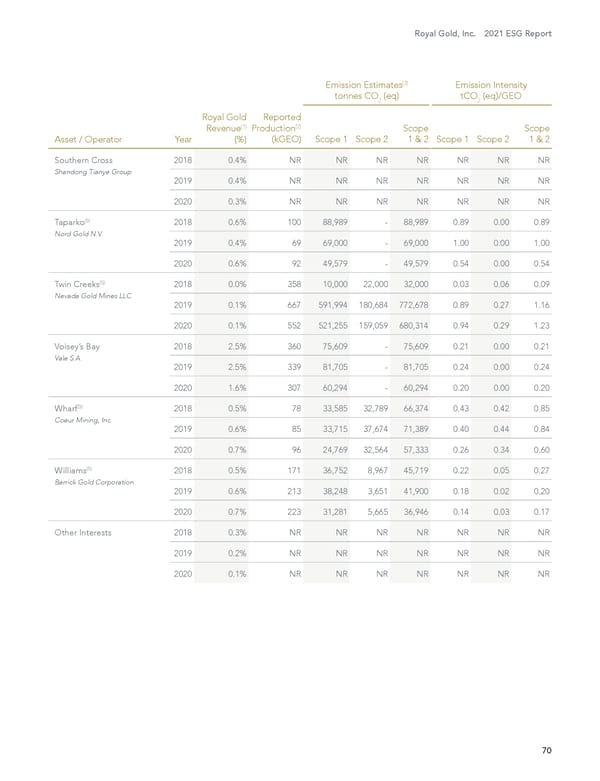
Royal Gold, Inc. 2021 ESG Report 70 Emission Estimates (3) tonnes CO 2 (eq) Emission Intensity tCO 2 (eq)/GEO Asset / Operator Year Royal Gold Revenue (1) (%) Reported Production (2) (kGEO) Scope 1 Scope 2 Scope 1 & 2 Scope 1 Scope 2 Scope 1 & 2 Southern Cross Shandong Tianye Group 2018 0.4% NR NR NR NR NR NR NR 2019 0.4% NR NR NR NR NR NR NR 2020 0.3% NR NR NR NR NR NR NR Taparko (5) Nord Gold N.V. 2018 0.6% 100 88,989 - 88,989 0.89 0.00 0.89 2019 0.4% 69 69,000 - 69,000 1.00 0.00 1.00 2020 0.6% 92 49,579 - 49,579 0.54 0.00 0.54 Twin Creeks (5) Nevada Gold Mines LLC 2018 0.0% 358 10,000 22,000 32,000 0.03 0.06 0.09 2019 0.1% 667 591,994 180,684 772,678 0.89 0.27 1.16 2020 0.1% 552 521,255 159,059 680,314 0.94 0.29 1.23 Voisey’s Bay Vale S.A. 2018 2.5% 360 75,609 - 75,609 0.21 0.00 0.21 2019 2.5% 339 81,705 - 81,705 0.24 0.00 0.24 2020 1.6% 307 60,294 - 60,294 0.20 0.00 0.20 Wharf (5) Coeur Mining, Inc. 2018 0.5% 78 33,585 32,789 66,374 0.43 0.42 0.85 2019 0.6% 85 33,715 37,674 71,389 0.40 0.44 0.84 2020 0.7% 96 24,769 32,564 57,333 0.26 0.34 0.60 Williams (5) Barrick Gold Corporation 2018 0.5% 171 36,752 8,967 45,719 0.22 0.05 0.27 2019 0.6% 213 38,248 3,651 41,900 0.18 0.02 0.20 2020 0.7% 223 31,281 5,665 36,946 0.14 0.03 0.17 Other Interests 2018 0.3% NR NR NR NR NR NR NR 2019 0.2% NR NR NR NR NR NR NR 2020 0.1% NR NR NR NR NR NR NR
 2021 Environment, Social and Governance Report Page 70 Page 72